
The median household in Great Britain is worth £293,700. On its own that number tells you almost nothing useful, because it lumps a 24-year-old with a student overdraft in with a 68-year-old who owns their house outright and has forty years of pension behind them. Split the same survey by age and the figure runs from £15,200 to just over half a million pounds.
That spread is the interesting part, and it’s what this article is about: what the typical UK household is actually worth at each stage of life, where the headline figure comes from, and how to read it without drawing the wrong conclusion about your own.
”Average” here almost always means the median
When people search for the average net worth by age, they usually want the typical household, not the arithmetic mean. The two are very different when wealth is involved. Add one billionaire to a room of a hundred people and the mean net worth rockets while the median, the person standing in the middle, barely moves.
Wealth is skewed enough that this matters a lot. One way to measure that skew is the Gini coefficient: a single figure that runs from 0, where every household holds exactly the same, to 1, where a single household holds the lot. The closer to 1, the more the total is bunched at the top. In its Wealth and Assets Survey for April 2020 to March 2022, the Office for National Statistics put the Gini for household wealth at 0.59. Income is shared far more evenly, at 0.36 in a separate ONS measure, and that gap is the point: wealth concentrates at the top in a way that monthly pay does not. Financial wealth on its own, meaning savings and investments outside property and pensions, reaches 0.87, close to the theoretical maximum. Because a mean would be dragged upward by that same handful of very wealthy households, the ONS reports medians, and so does every figure below.
Read these as a backdrop for context, not a target to hit. Verdly publishes for education, not financial advice, and your circumstances will differ, so speak to a regulated adviser for any decision specific to you.
Median net worth by age band
Here is median household total wealth by the age of the household head, from the latest ONS data covering April 2020 to March 2022.
| Age of household head | Median household net worth |
|---|---|
| 16 to 24 | £15,200 |
| 25 to 34 | £109,800 |
| 35 to 44 | £209,600 |
| 45 to 54 | £301,900 |
| 55 to 64 | £496,500 |
| 65 to 74 | £502,500 |
| 75 and over | £373,100 |
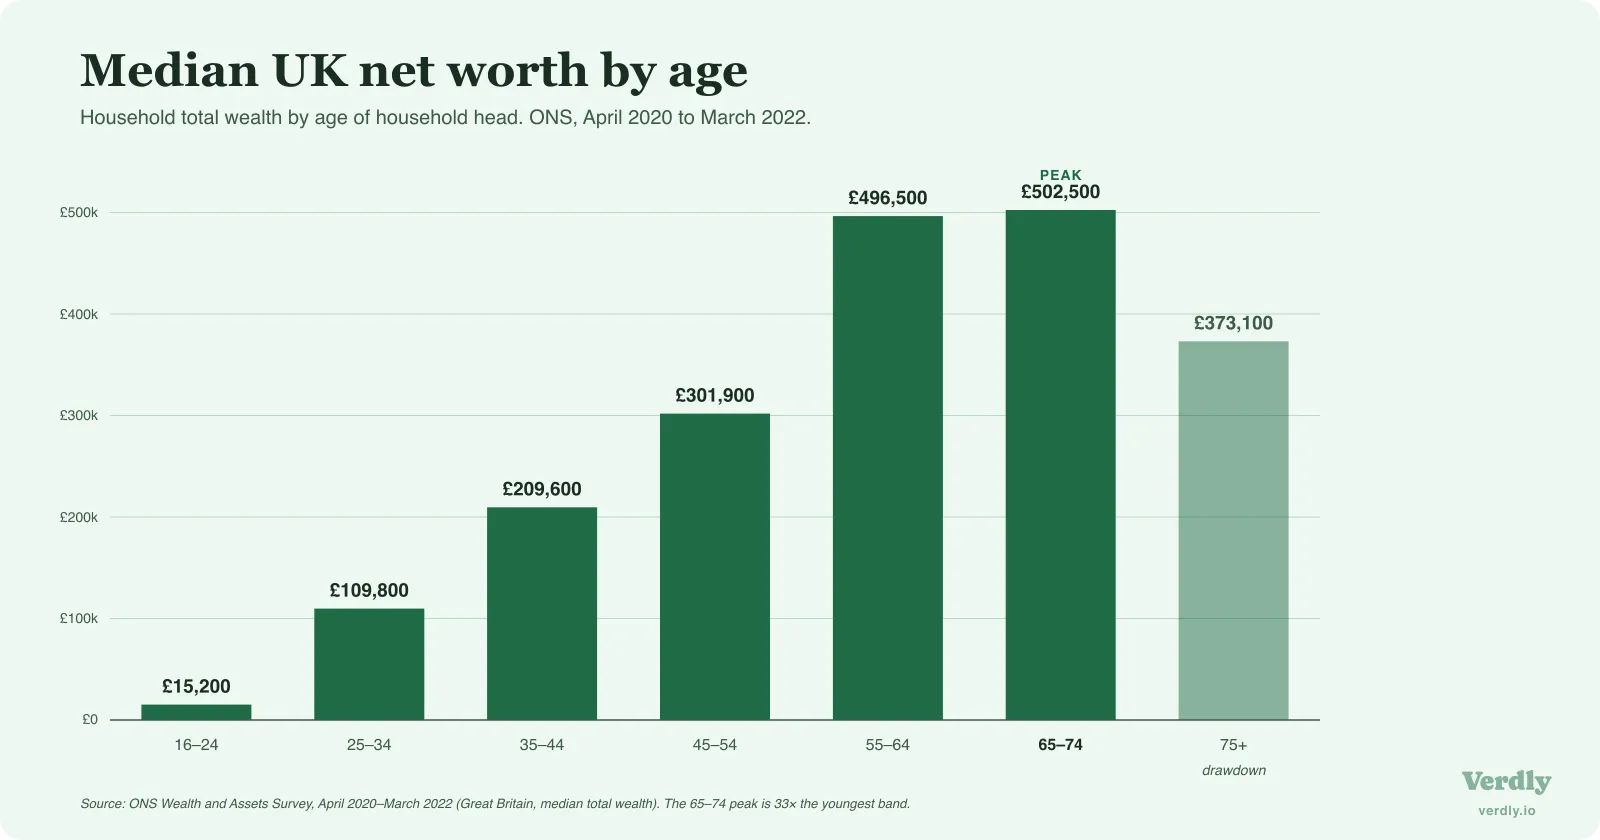
The shape is the story. Wealth climbs steeply from the mid-twenties, roughly doubles between the 25 to 34 and 35 to 44 bands, and keeps rising until it peaks at £502,500 for households headed by someone aged 65 to 74. That peak is 33 times the figure for the youngest households. After state pension age it starts to fall again as people draw down what they’ve built.
One caveat before you place yourself on this ladder: these bands are grouped by the age of the household head, and they describe whole households, not individuals. A 30-year-old living alone and a 30-year-old in a dual-income couple that owns a flat sit in the same row but have very different balance sheets, which is why whether your partner’s money counts in your figure has to be settled before any of these bands mean anything.
What the ONS actually counts as wealth
The figure above is what the ONS calls total wealth, and it is broader than the number most people picture when they add up their own net worth. It has four parts:
- Net property wealth, the value of any property minus the mortgage, at 40% of the total.
- Private pension wealth, the value of occupational and personal pensions built up so far, at 35%.
- Net financial wealth, savings and investments minus debts, at 14%.
- Physical wealth, vehicles, valuables and household contents, at 10%.
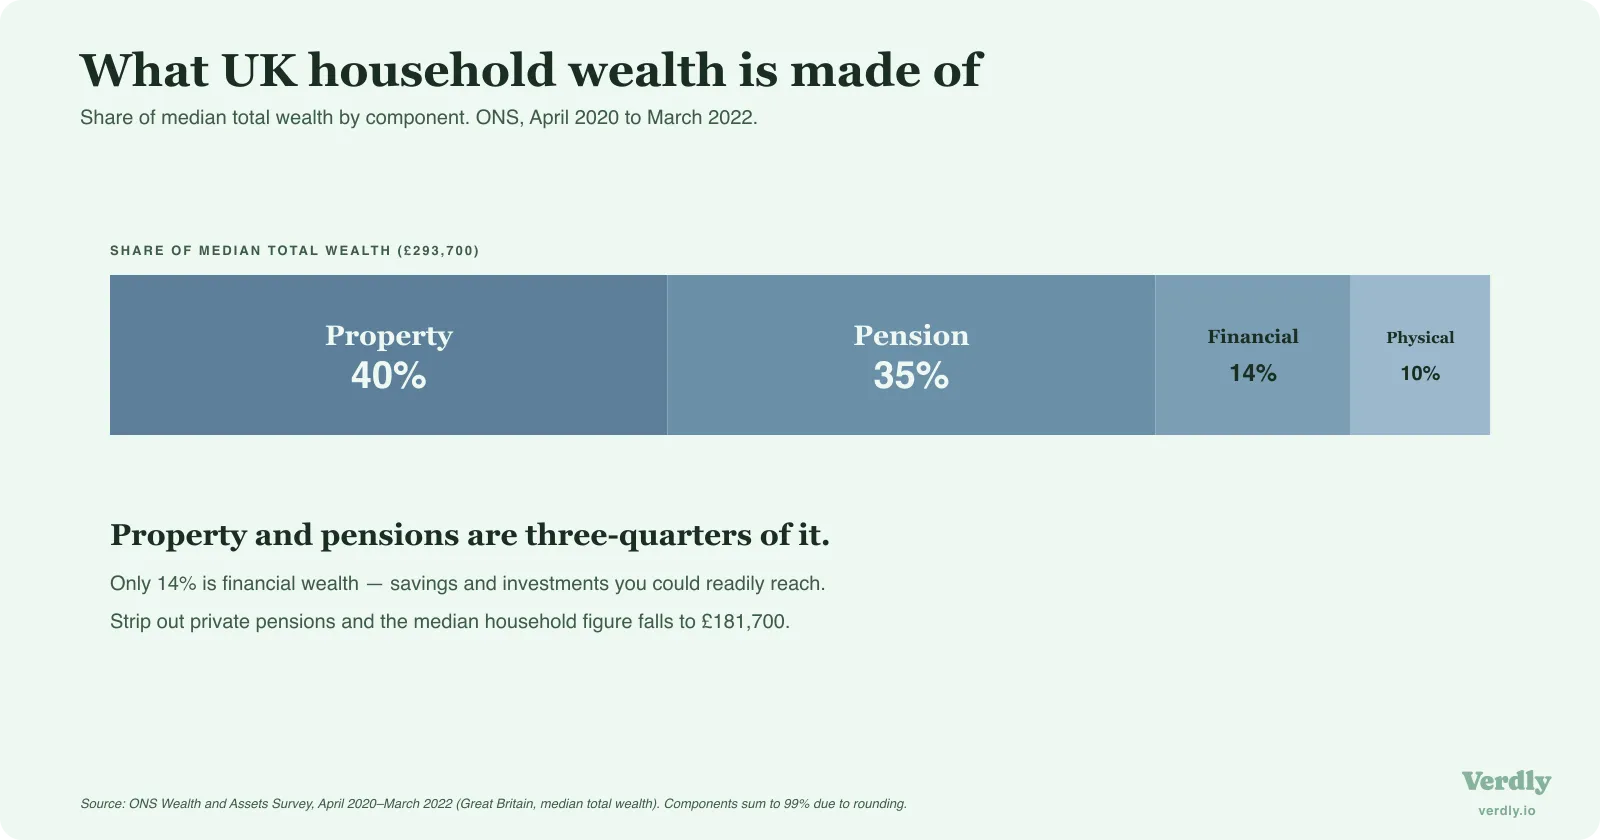
That second line is the one that catches people out. Private pension wealth is the second-largest component of the typical household’s net worth, just behind property, and it is fully baked into the £293,700 headline. If you tot up your own figure and leave the pension out, you are not measuring the same thing the ONS is. The gap is large: median household wealth excluding private pensions was only £181,700 over the same period. Whether a pension belongs in your personal number is a reasonable debate, covered in a separate guide on how to treat your pension, but the benchmark you’re comparing against includes it.
Two more boundaries worth knowing. The survey covers Great Britain, so Northern Ireland is not in these figures. And the State Pension is excluded throughout, because it is a future entitlement rather than an owned asset you could value and sell.
Why the curve rises, then dips
The age gradient is not mysterious once you break it into its parts.
Property does most of the early work. The average first-time buyer in England was 34, according to the English Housing Survey for 2022 to 2023, which is why households under 35 tend to hold very little property wealth and why the figure jumps so sharply once a mortgage is underway. Every payment shifts a slice of debt into equity, and for a long stretch of recent history rising house prices did the rest.
Pensions compound in the background. An older household has simply had more years of contributions, employer top-ups and investment growth, so by the time someone reaches their late fifties the pension line is often doing as much heavy lifting as the house.
Then it reverses. Once people retire, they stop adding to these pots and start spending them. That is the ordinary, healthy reason median wealth slips from £502,500 in the 65 to 74 band to £373,100 for households aged 75 and over: the money is being used for the retirement it was saved for.
What the figure is really made of
It helps to see what sits inside one of these bands, because the total can be misleading on its own. Take households headed by someone aged 25 to 34, with a median net worth of £109,800. You might assume a good chunk of that is money in the bank. It isn’t. Median financial wealth, meaning savings and investments outside a pension, was just £1,300 for that age group in the same period. Almost the entire £109,800 is property equity and pension value, not cash anyone could spend this week.
That pattern holds across the population. Median household financial wealth was only £10,400 for all households combined. The typical UK household is not sitting on a large pile of accessible savings; its wealth is tied up in a home and a pension, both of which are hard to touch before later life.
The practical upshot is about how you read your own position. If you rent, haven’t yet started building a pension, or are early in a mortgage, you can sit well below your age band’s median and still be doing nothing wrong, because the households pulling that median up are counting equity and pension pots you simply haven’t had time to accumulate. The composition of a number matters as much as its size.
The average hides an enormous spread
Even inside a single age band, “typical” covers a huge range. Zoom out to the whole population and the distance between the ends is stark. In the same ONS release, the least wealthy tenth of households held £16,500 or less, while the wealthiest tenth held £1,200,500 or more. The top 1% started at £3,121,500. The wealthiest 1% of households held as much between them as the least wealthy half of the country combined.
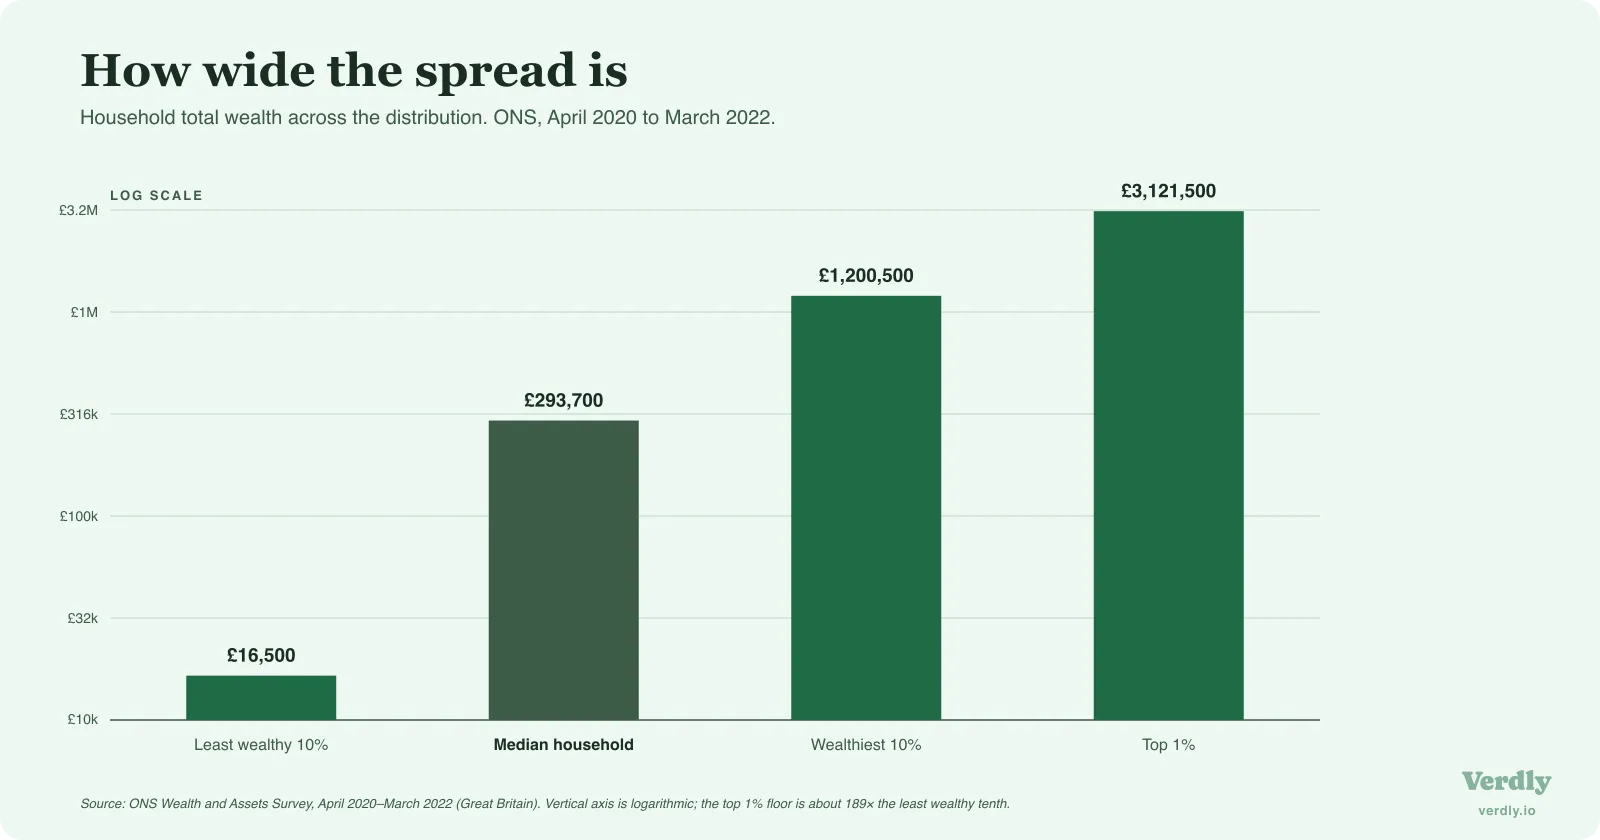
This is why a single median, at any age, is a blunt instrument. Landing above or below it tells you where you sit in a line-up, not whether your own plan is working. Two households in the 45 to 54 band can both be “around average” and be on completely different trajectories, one climbing, one treading water. The direction your number moves over the years is far more informative than the gap between it and a national midpoint measured over a two-year window.
Where you live and whether you own
Two factors move the median almost as much as age does.
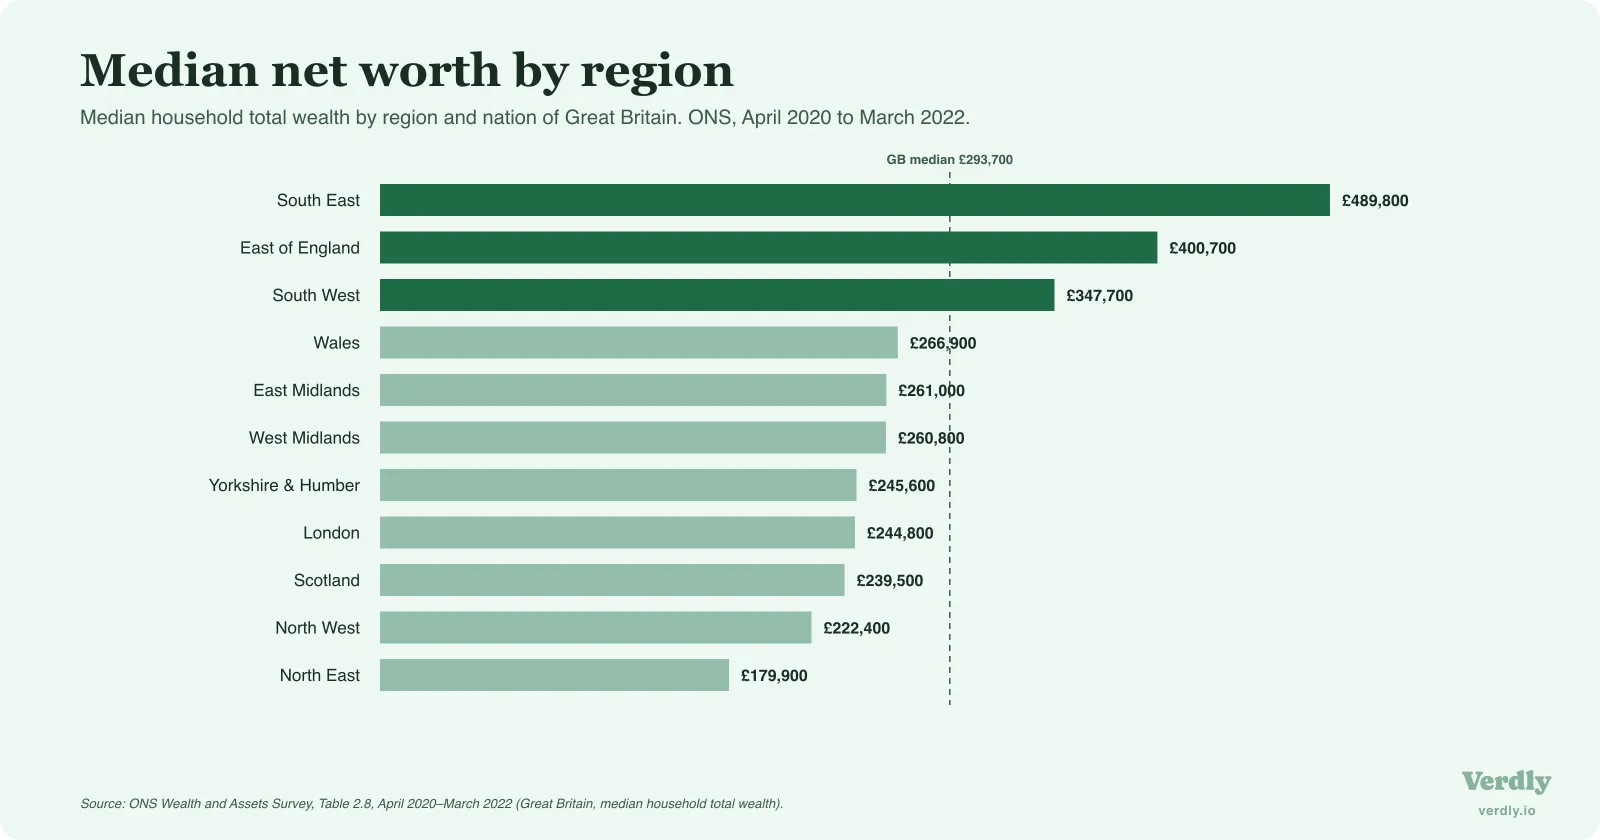
Region is the first. The South East was the wealthiest part of Great Britain at £489,800, more than double the North East at £179,900. Only three regions cleared the national median at all: the South East, the East of England at £400,700 and the South West at £347,700. London is the surprise, with its median mid-table at £244,800: the capital pairs a large renting population with some of the country’s priciest homes, so its wealth is split unusually wide between top and bottom. The ONS does caution that London’s figure this round is less certain than other regions’, because fewer London households responded during the pandemic, so read its exact rank with that in mind. A household that looks wealthy against the national figure can look ordinary in its own postcode, and the reverse.
Tenure is the second, and it is dramatic. Households that owned their home outright had median wealth of £647,400. Those buying with a mortgage sat at £404,700. Renters were at £40,800. Almost all of that gap is property and the pension savings that tend to travel alongside ownership, which is a reminder that a benchmark built largely on housing will always flatter the people furthest along the ownership path.
How fresh is this, really
Honesty about the data matters more than a clean headline. This is Round 8 of the Wealth and Assets Survey, covering April 2020 to March 2022 and published in January 2025. Three things are worth holding in mind.
It was collected during the pandemic, by telephone rather than face to face, which the ONS flags as a source of added uncertainty, particularly for property wealth in London. The survey’s official accreditation was suspended in June 2025 while the ONS works on quality, so the figures are best read as directional. And it is already a few years old: the next round, covering April 2022 to March 2024, is provisionally due in 2026, and given how much house prices, interest rates and pension valuations have moved since 2022, some of these bands will shift when it lands. This benchmark is refreshed when new ONS data is published.
None of that makes the numbers useless. It makes them a reasonable map of the terrain rather than a precise measurement of today.
Reading your own number
If you take one thing from the table, let it be the shape rather than any single row. Wealth builds slowly, then faster as property and pensions compound, and the households at the top of the curve mostly got there by staying invested through a lot of ordinary years, not by clearing a benchmark in any one of them.
A national median is a snapshot of other people at a moment that has already passed. Your own figure, watched over time, answers the question the benchmark can’t: is the line going the right way? That is the point of keeping a net worth tracker at all, and if you’d rather not run yet another spreadsheet, you can see where your own figure sits and how it moves from one month to the next. The average by age is worth a glance. Your own trend is worth a habit.