


You track your net worth on your own. Your partner has their own pension, their own ISA, and their own view on how often either of you should look at them. The house is in both names. The mortgage is in both names. The savings account you use for holidays is in one of them, for reasons neither of you can now remember.
So when you write down a single figure, whose is it?
There are two right answers, and the trouble only starts when you build your number one way and measure it against a benchmark built the other. That happens more often than it should, because the phrase “average UK net worth” is doing duty for two different things.
Verdly publishes for education, not financial advice; speak to a regulated adviser for decisions specific to your situation.
The two numbers Britain actually publishes
The Office for National Statistics measures wealth both ways, in two separate releases, and the distance between them is not small.
The headline figure comes from the ONS Wealth and Assets Survey for April 2020 to March 2022, which puts median household total wealth at £293,700. That is a household measure: everything owned by everyone under one roof, minus everything they owe.
Two caveats belong right next to that number. The ONS suspended accreditation of the Wealth and Assets Survey from this round over data-quality concerns, and collected it by telephone during the pandemic, which under-represented renters. Treat £293,700 as indicative rather than precise to the pound.
The other figure is per person. The ONS release on the distribution of individual total wealth, covering April 2018 to March 2020, puts median individual total wealth at £125,000. It is still the most recent in its series, so there is no individual equivalent of the 2020 to 2022 household round.
Set those two side by side with care. The windows are two years apart, the releases are different, and they sit either side of a change in how the ONS estimates defined benefit pension wealth. The gap between them measures nothing clean. What they establish is simpler: British wealth has an official household version and an official individual version, a long way apart.
Which means the figure in your head labelled “the average” may be answering a question you weren’t asking.
Why halving the household figure doesn’t work
The instinct is to take a household total, split it down the middle, and call that your share. For some households that lands close enough. For plenty it doesn’t, and the reason sits in what household wealth is made of.
In those same April 2020 to March 2022 figures, net property wealth made up around 40% of total household wealth and private pension wealth around 35%, with net financial wealth at 14% and physical wealth at 10%.
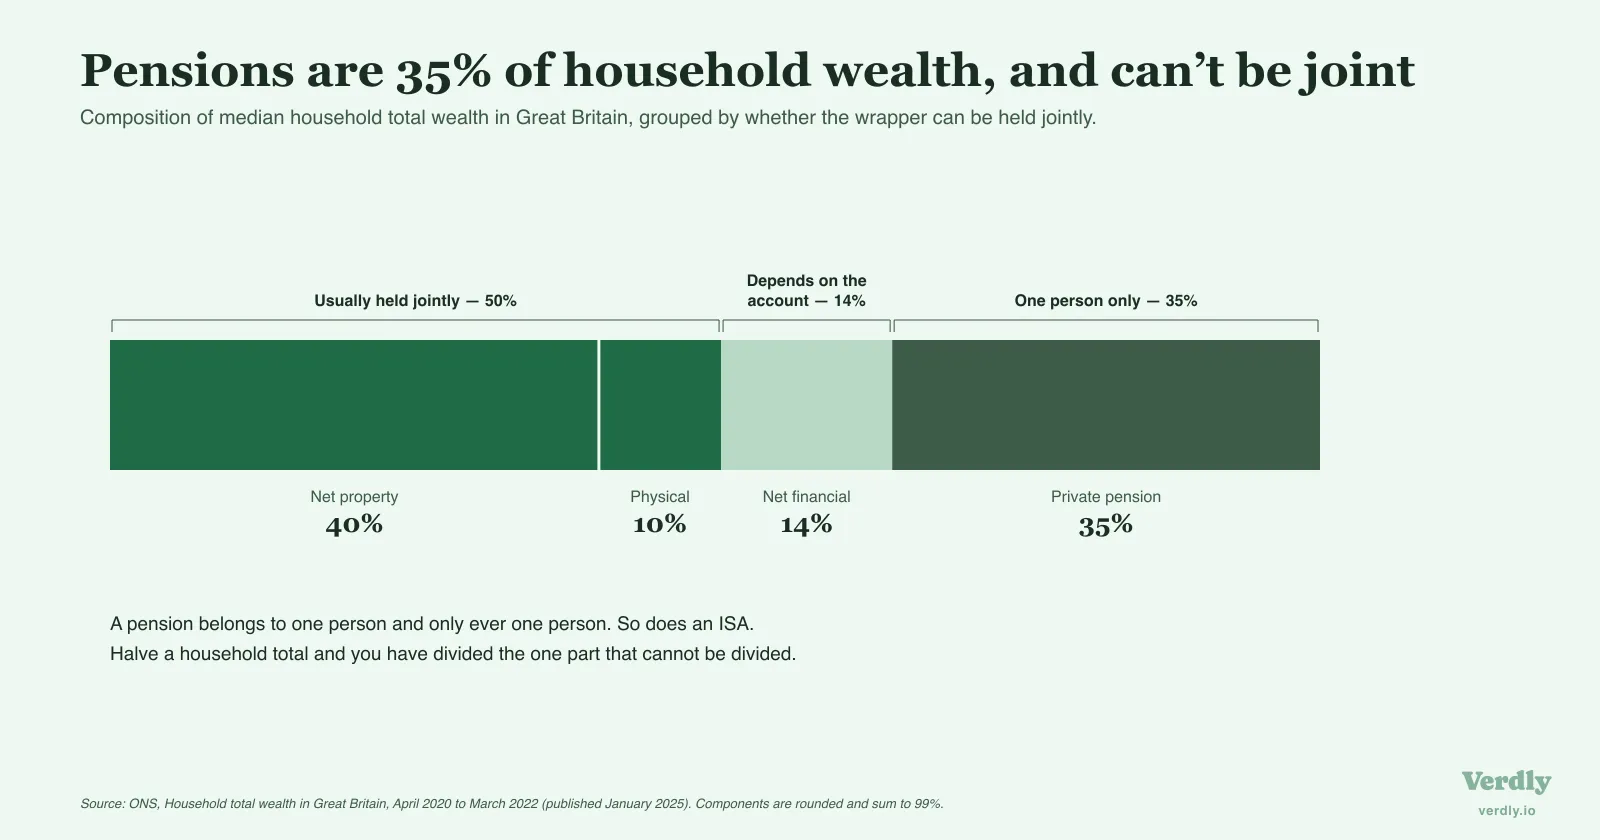
Look at the top two. Property is the asset most likely to be shared: joint names, joint mortgage, one roof. Pensions are the opposite, and so are ISAs. Both are individual by construction.
So roughly a third of the average household’s wealth sits in wrappers that can’t be shared, and it’s rarely split evenly between two people. Career breaks, part-time years, a decade of different employers on different contribution rates: two pension pots in the same house often differ by a factor of two or three. Halving the total papers over all of it.
The ONS faces the same problem. Its methodology note on measuring wealth on an individual level, last revised in October 2018, sets out rules rather than a blanket split: the main residence and its mortgage divide equally between the partners, physical wealth is shared between the adults, and pension wealth stays with whoever holds it.
Note what that amounts to. Even the national statistician only halves the things that are genuinely shared, and never the pension.
Which lines can only ever belong to one of you
Sorting this is less painful than it sounds, because most lines declare themselves.
Individual, always: pensions of every kind, ISAs, and anything held in a sole name. Whose name is on the account is the entire test, whatever the household calls the money that feeds it.
Shared, usually: a home in joint names, a joint current or savings account, and any borrowing taken out together.
Then the awkward middle. An asset in one name that both of you treat as shared: the flat bought before you met, the savings account one of you opened because the other couldn’t face the paperwork. No accounting rule settles these, only a decision. And it only causes trouble when the two of you make different ones without saying so.
One trap deserves naming. If you each keep an individual figure and both write down the full joint mortgage, that debt has been counted twice. The usual convention is to halve joint assets and joint debts for the individual view, so the two halves add back to the household total. Bookkeeping, not law: on a joint mortgage, both borrowers are generally liable for the whole balance, not half each.
Hannah and Marcus, counted both ways
Say Hannah and Marcus own a house worth £310,000 with £145,000 left on a joint mortgage, so £165,000 of equity between them. They hold £8,000 in a joint savings account.
Hannah has £62,000 across two workplace pensions, £18,000 in a Stocks and Shares ISA, and £2,000 in her current account. Marcus has £24,000 in a pension, £4,000 in an ISA, £1,500 in his current account, and £3,000 left on a car loan in his name.
Counted as a household, they’re worth £281,500.
Counted individually, splitting the house and the joint savings down the middle, Hannah is worth £168,500 and Marcus £113,000. Those still add back to £281,500. Nothing has been invented or lost. All that’s changed is the unit.
Now put each figure next to the benchmark that matches it. Their household £281,500 sits just under the £293,700 median household total wealth for April 2020 to March 2022. Against the £125,000 individual median for April 2018 to March 2020, Hannah is comfortably above and Marcus below. The windows don’t line up, but the shape holds: one household, three defensible readings, a different verdict depending which you pick up.
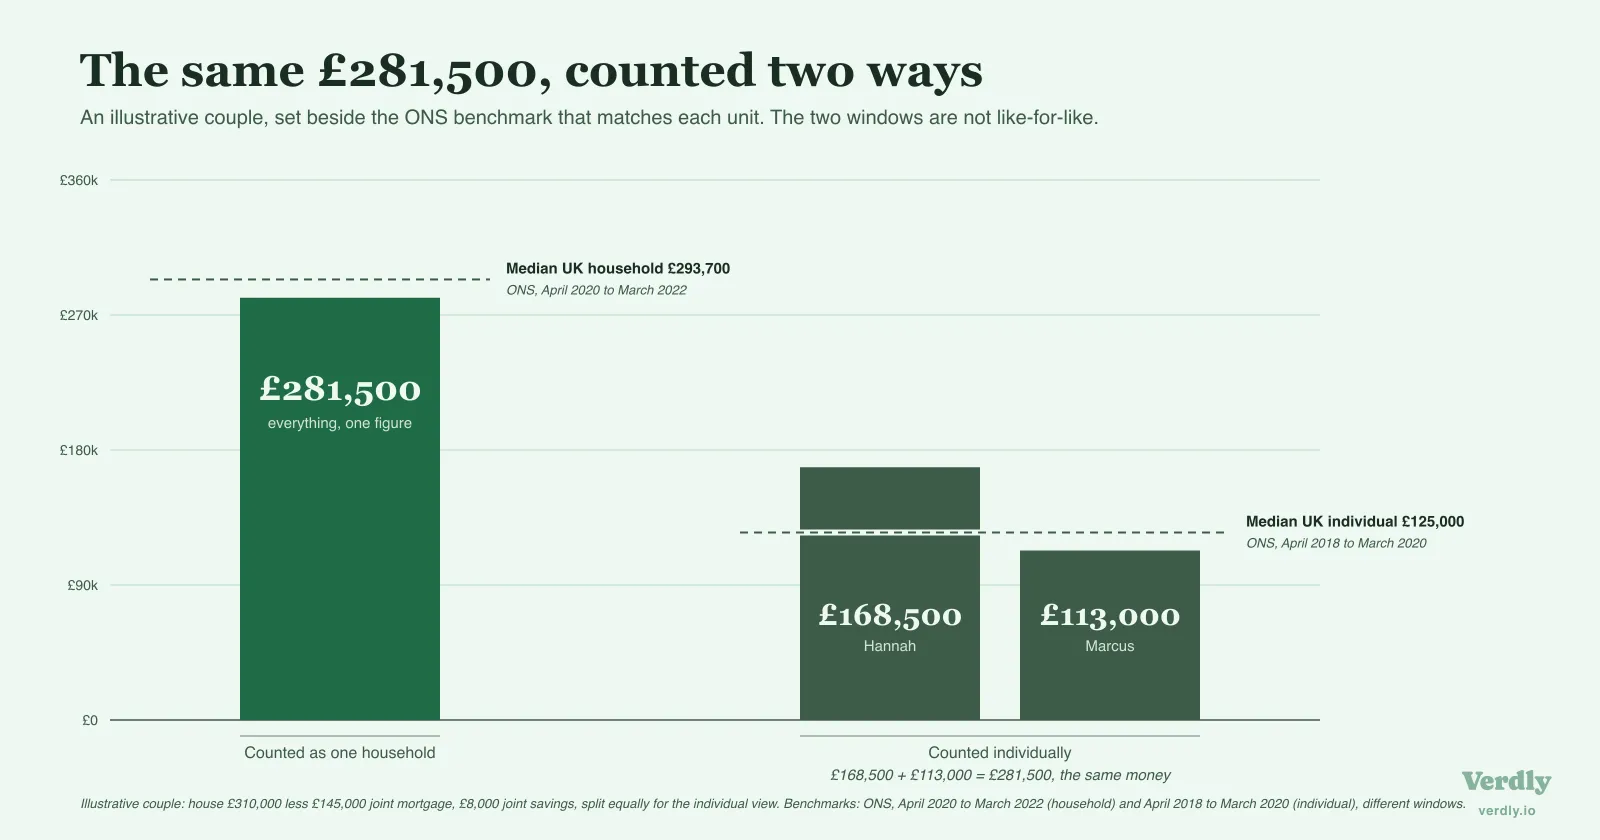
That’s the whole hazard. Not that any of the numbers are wrong. That the same finances can be made to look ahead or behind depending on a choice nobody wrote down.
Pick a unit, then label it
The fix isn’t clever. It’s clerical.
Choose which unit you’re tracking, write it down wherever you keep the figure, and hold it steady month to month. A net worth history is only useful because it compares to itself, and it stops doing that the moment the unit changes halfway through. If Marcus starts folding Hannah’s pension in during a good month, the line stops being a record and starts being a mood.
Running both views is a reasonable answer too, and for many couples the more informative one. The household figure tracks what you’re building together; the individual figure shows what each of you would still be standing on alone, which matters most for pensions. It’s the same instinct behind tracking total and liquid net worth as separate lines rather than forcing one figure to answer every question, and the reason it helps to keep each account as its own line with an owner attached, so the split is a filter rather than a rebuild.
Whichever you choose, the rule that does the real work is this: never hold a figure built one way against a benchmark built the other.
Be wary, too, of any comparison that hasn’t shown you its unit. Plenty of “average net worth for a couple” content multiplies a single-person figure, often by around 1.7, with no sourced basis. Geography moves it further anyway: in the individual data for April 2018 to March 2020, median individual wealth ran to £236,000 in the South East against £79,000 in the North East. Same measure, same definition, a £157,000 gap. Before asking whether you’re above average, ask which average, over which years, counting whom.
The part that isn’t a bookkeeping question
One boundary deserves stating plainly. How you split assets for tracking has no bearing on how anything would be treated legally. Cohabiting couples in England and Wales don’t hold the same legal position as married couples, and a 50/50 line in a spreadsheet neither creates rights nor removes them.
That belongs with a solicitor, not a net worth tracker. A tidy spreadsheet should never be read as an answer to the harder question.
One household, two honest answers
Net worth feels like it should be a fact, and at the level of a single account it is. Widen the frame to two people and it becomes a fact plus a choice: the balances are what they are, but the boundary around them is yours to draw.
A boundary only misleads when it’s invisible. Drawn on purpose and written down, a household figure and an individual figure tell you different true things about the same pair of lives, much as a pension you can’t touch for twenty years and a decade of cash ISA interest are both wealth and behave nothing alike. What counts in your net worth was never really about the assets, but about being clear on what you’re measuring, then measuring the same thing next month.
Last reviewed 3 August 2026.