
Every April, the question turns up at some point: what is this cash ISA actually doing for me?
It’s usually triggered by the same thing. A statement lands, a transfer is made, an end-of-tax-year list of things to do crosses the kitchen counter. The balance ticks up by a known amount each year. The interest gets paid. The wrapper sits there doing its job. And the question of what does this look like in ten years never quite gets answered, because the answer depends on a chain of assumptions that nobody walks through in one sitting.
This piece walks through it. Verdly publishes for education, not financial advice; speak to a regulated adviser before making decisions specific to your situation. What follows is a model, not a recommendation: the same £20,000 input run through three different rate assumptions, and then the same model re-run for the world after April 2027, when the cash ISA limit drops to £12,000 for anyone under 65.
The setup
Take a clean example. Someone puts £20,000 into a cash ISA on 6 April 2026, the first day of the current tax year. They don’t add anything else. They don’t withdraw. The balance is left in a fixed-rate cash ISA at a single provider, with interest paid annually and reinvested. Ten years on, what’s there?
That’s the question. The answer depends entirely on the rate.
Layer 1: the current rate
Best-buy one-year fixed cash ISAs in May 2026 sit between 4.1% and 4.66% AER. For a clean working figure, call it 4%. Most people won’t hit 4.66% across a full ten-year stretch. Fixed-rate deals end, rates drift, the best-buy spot rotates. But 4% is a defensible mid-case.
At 4% compounded annually, £20,000 grows to:
| Year | Balance |
|---|---|
| Year 0 | £20,000 |
| Year 1 | £20,800 |
| Year 3 | £22,497 |
| Year 5 | £24,333 |
| Year 7 | £26,319 |
| Year 10 | £29,605 |
So £20,000 becomes roughly £29,600. A gain of just under £9,600 across the decade. The compounding is doing real work: in year 10 alone, the interest earned is about £1,140, compared to £800 in year 1.
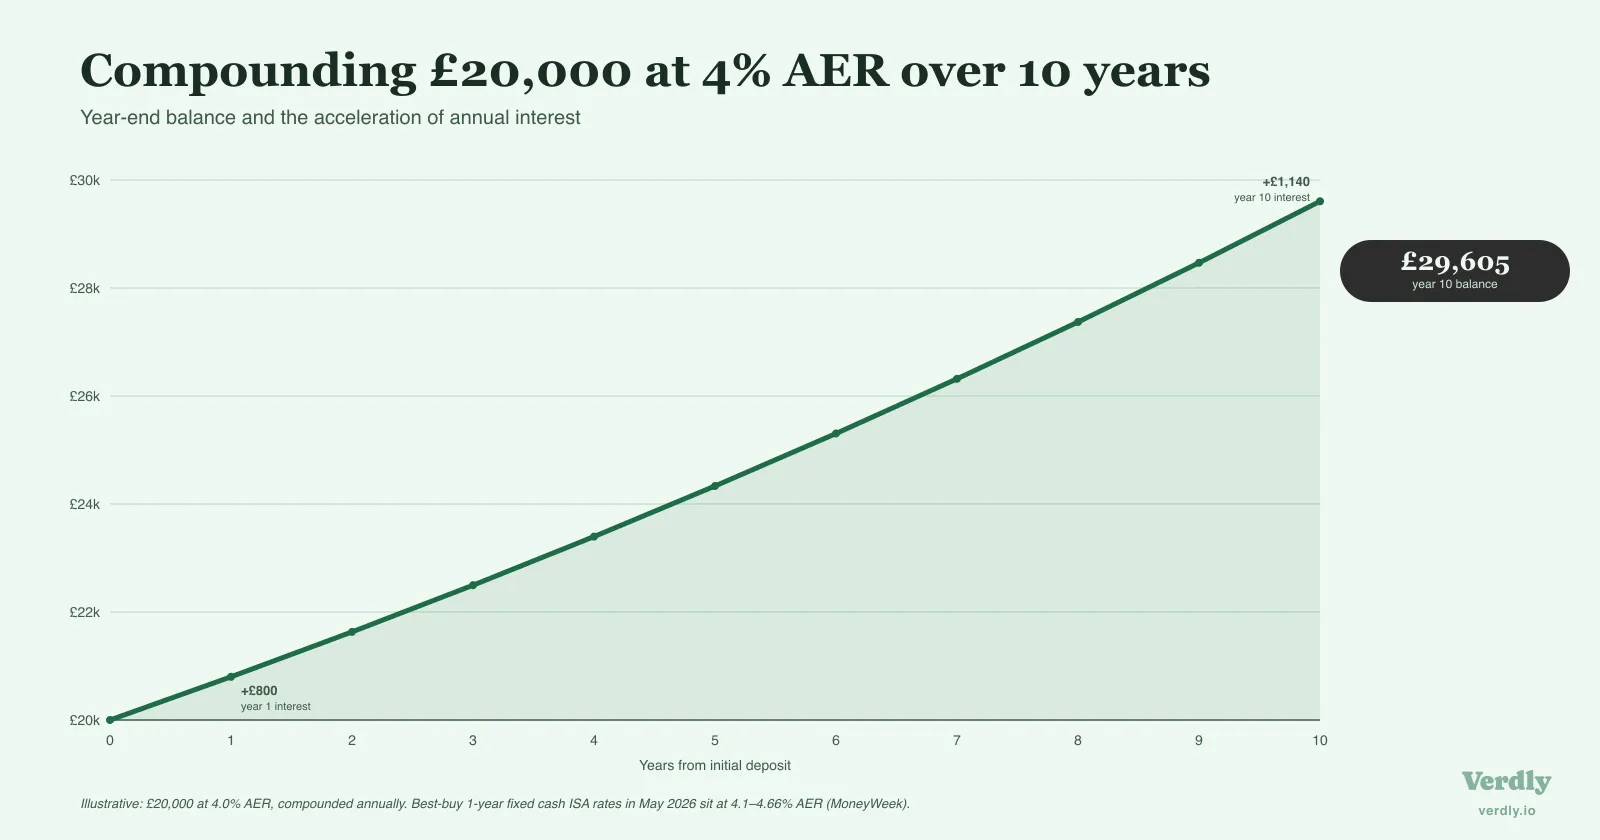
This is the figure the calculators on ISA.co.uk, Hargreaves Lansdown and J.P. Morgan Personal Investing produce. They stop there. But that figure assumes the rate stays at 4% for ten consecutive years, which is the assumption least likely to hold.
Layer 2: the long-run average
The best available read on what cash ISAs have actually paid over the long term comes from Moneyfacts’ long-run average data. Across the last decade, the average UK cash ISA paid closer to 1.2% to 1.8% AER. The current 4% range is unusual by historic standards; the Bank of England held Bank Rate at 3.75% on 30 April 2026, and rates haven’t been this high for sustained periods in living memory.
At a 1.5% average, the midpoint of the Moneyfacts range, the same £20,000 grows to:
| Year | Balance |
|---|---|
| Year 0 | £20,000 |
| Year 5 | £21,546 |
| Year 10 | £23,210 |
£23,200. A gain of £3,200 across the decade.
The difference between the two scenarios isn’t small. £6,400 separates the 4% case from the 1.5% case over ten years on the same £20,000 deposit. That gap is what rate volatility actually costs, and it’s the gap most calculators don’t show, because they ask the saver to pick a single rate up front.
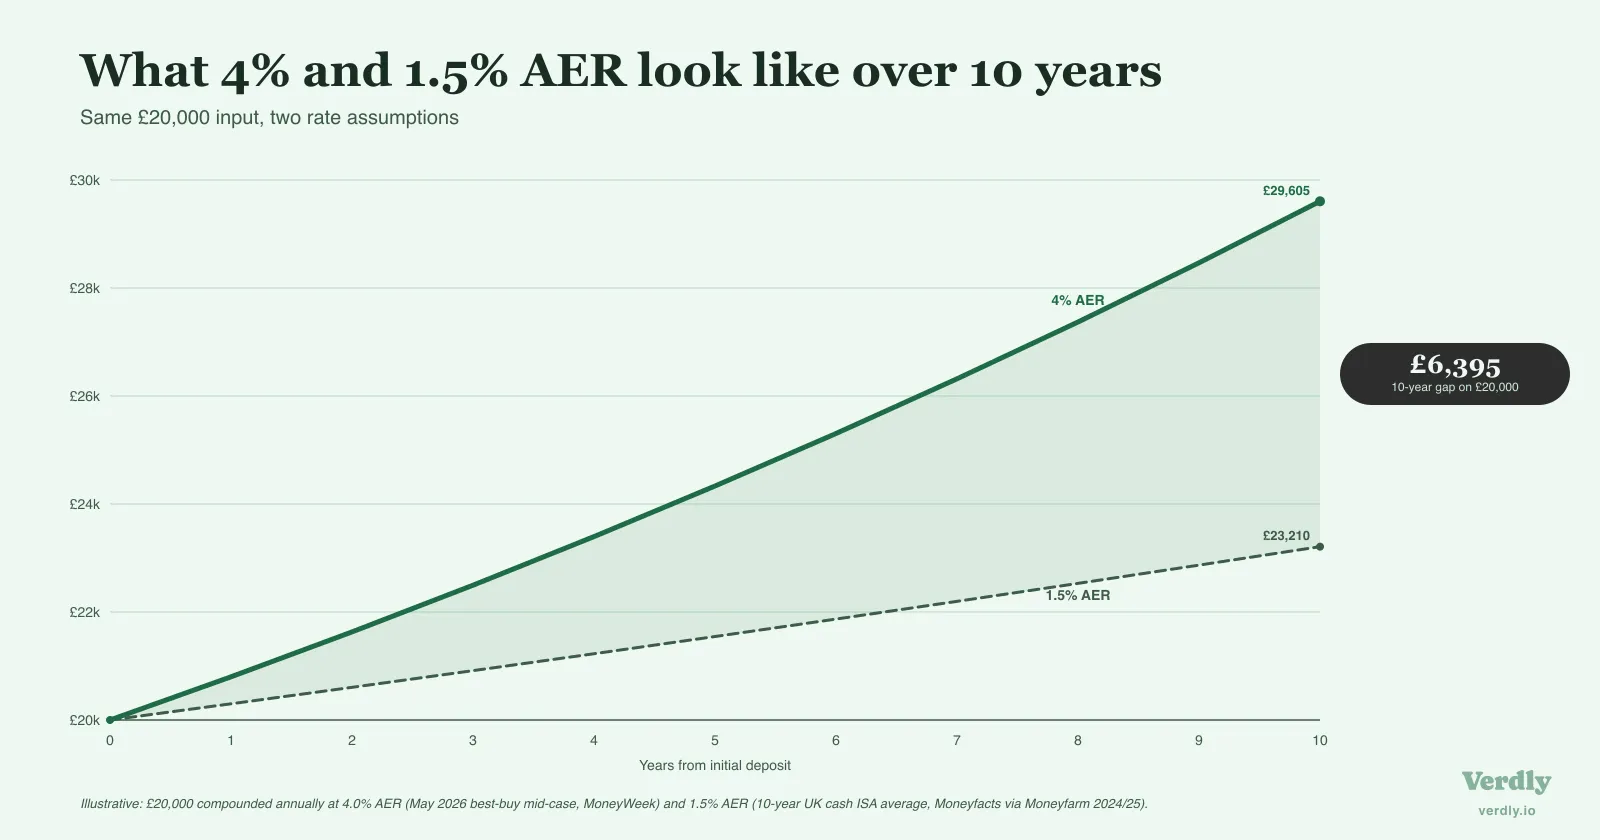
The honest version sits somewhere between the two. Cash ISA rates have been climbing since 2022, plateaued through 2025, and started to drift as the Bank of England considered cuts. A reasonable working assumption is that the rate over the next decade lies between today’s 4% and the historic 1.5%, weighted by how long current conditions persist.
Layer 3: what the money is actually worth
Both figures above are nominal. They describe what the balance will read on the screen. They don’t describe what the balance will buy.
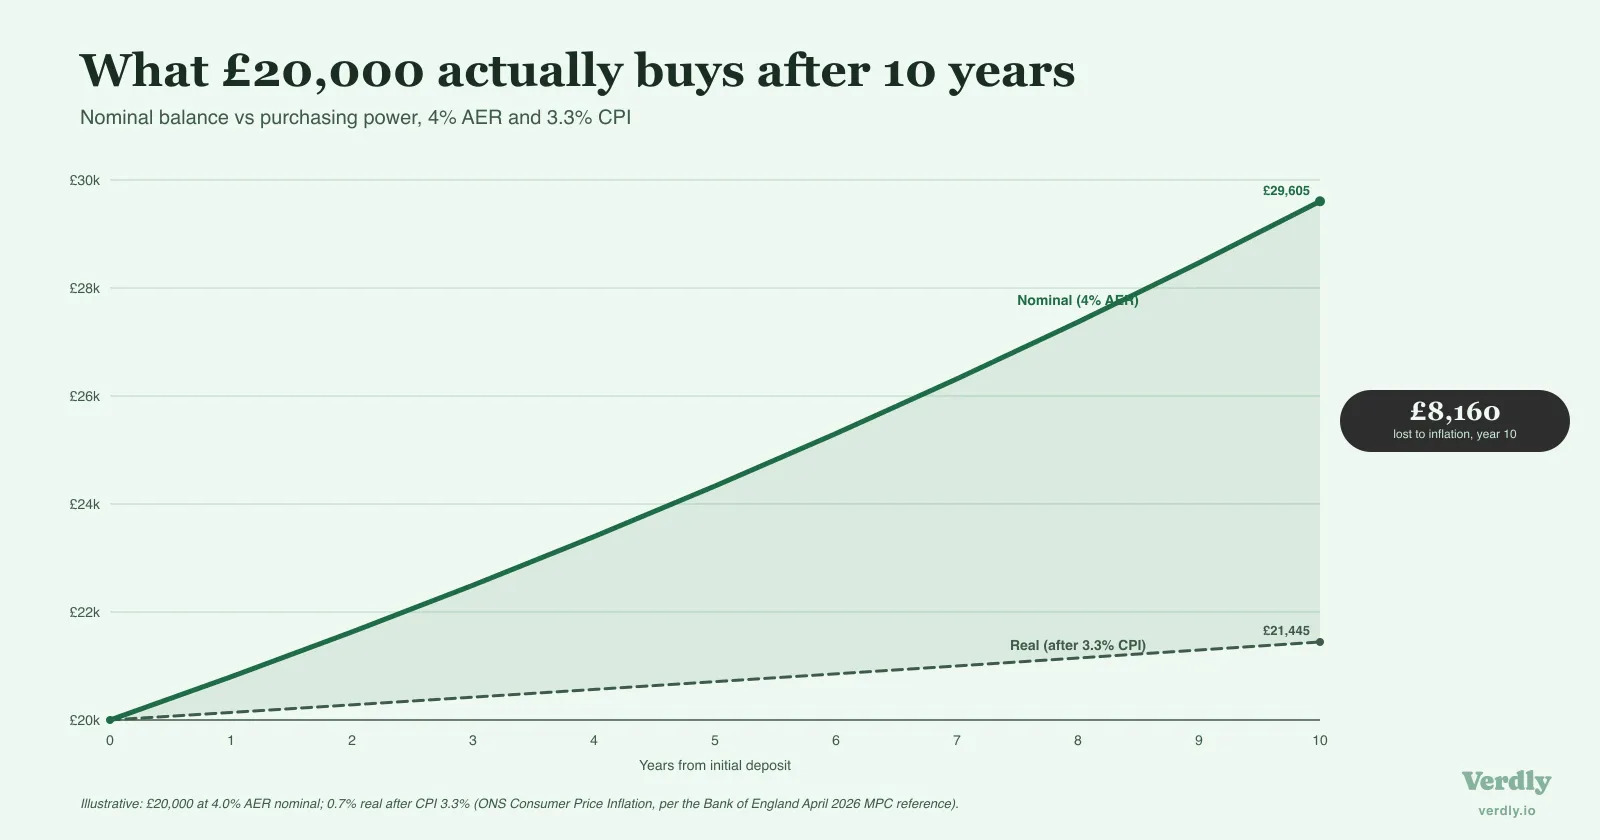
CPI inflation in the UK ran at 3.3% in the period referenced by the Bank of England’s April 2026 monetary policy decision. If that rate held for a decade (it won’t, but the Bank’s 2% target has been undershot or overshot for almost every recent year), the real return on a 4% cash ISA is closer to 0.7% per year.
At 0.7% real growth, £20,000 buys, in today’s money, around £21,400 at the end of ten years. The screen reads £29,600. The actual purchasing power has barely moved.
At 1.5% nominal against 3.3% CPI, the real return is negative. £20,000 loses ground in purchasing-power terms even as the screen ticks up: a real-terms balance of around £16,700 at the end of ten years, despite a nominal balance of £23,200.
A caveat worth flagging. CPI is the national basket the ONS tracks. The basket any particular household buys looks different. Households that spend a higher share on energy or food felt a noticeably higher personal inflation rate than CPI in 2022 and 2023, when both spiked. The 0.7% real figure is built on the national number; the lived experience for any one household sits somewhere either side of it.
This is the bit calculators don’t show, and the bit that matters most when someone holds cash over a long horizon. The wrapper protects the nominal growth from tax. It doesn’t protect the purchasing power from inflation.
What’s actually happening behind the deposits
Cash ISAs aren’t gathering dust. The opposite. HMRC’s Annual Savings Statistics 2025 showed cash ISA subscriptions grew by around 125% between the 2021/22 and 2023/24 tax years, while stocks and shares ISA subscriptions fell by around 9% over the same window. The average cash ISA balance reached about £26,900 by April 2024. The average annual subscription sat near £7,000.
That’s a behavioural pattern, not a coincidence. After 2022, savings rates climbed sharply and instant-access yields hit headlines. Cash felt like the rational place to be, especially for households that had watched stocks-and-shares balances move sideways or down. Money flowed in. The cash ISA, dormant for most of the 2010s, became the workhorse wrapper.
The Treasury noticed.
What changes in April 2027
In the Autumn Budget 2025, the Chancellor announced a structural reform to the cash ISA limit. The headline mechanics:
- The total ISA allowance stays at £20,000 per tax year.
- The cash ISA portion drops to £12,000 per tax year for anyone under 65, with the remaining £8,000 available only for stocks and shares, Innovative Finance, or Lifetime ISAs.
- Anyone aged 65 or over is exempt; the full £20,000 can still go into cash.
- Transfers from a Stocks and Shares or Innovative Finance ISA into a cash ISA are banned for under-65s, which closes the most obvious route around the cap.
- Interest on cash held inside a stocks and shares ISA is charged at a flat 22%, so a second rule taxes the cash itself rather than blocking the way in.
The reform takes effect from 6 April 2027, which means the 2026/27 tax year is the last full year of the £20,000 cash allowance for everyone under 65.
There’s a subtlety in the structure. For under-65s, the £8,000 non-cash portion of the £20,000 allowance has to be deployed into a Stocks and Shares ISA, a Lifetime ISA, or an Innovative Finance ISA. If it isn’t used in the tax year, it falls away; ISA allowances don’t roll forward. The reform is structural, not procedural. Existing balances aren’t touched; existing accounts keep working. The cap controls what can be added each tax year from April 2027 onward.
The model, re-run at £12,000
Put the same assumptions through the post-2027 cap. Someone under 65 maxes their annual cash ISA allowance, now £12,000, and leaves it for ten years.
At 4% nominal growth:
| £20,000 input | £12,000 input | Gap | |
|---|---|---|---|
| Year 5 | £24,333 | £14,600 | £9,733 |
| Year 10 | £29,605 | £17,763 | £11,842 |
At 1.5% nominal growth:
| £20,000 input | £12,000 input | Gap | |
|---|---|---|---|
| Year 10 | £23,210 | £13,926 | £9,284 |
The gap between £20,000-capped and £12,000-capped growth is roughly equivalent to the cap reduction itself, just spread across a decade of compounding. Nothing exotic happens. Less goes in; less compounds.
The more interesting effect is on the rate of allowance use. Under the £20,000 cap, HMRC’s data shows the average cash ISA subscription was around £7,000, well below the cap. Most savers weren’t maxing the £20,000 allowance, and so for them the £12,000 cap doesn’t change much. The cap is a constraint that bites only at the top end of subscribers; the median saver is unaffected by the headline change. Whether that matters depends on which group a given saver is in.
The wrapper as a finite slot
This is where the framing usually shifts.
A cash ISA, before the cap change, was effectively unlimited from the perspective of a typical saver: very few people had £20,000 a year of new cash to wrap. Under the reform, that’s no longer quite true. The £12,000 figure sits much closer to the average annual subscription, which means more savers will hit the ceiling.
Once a wrapper has a real ceiling, it starts to behave like a slot, not a default. Each tax year that passes uses up that year’s allowance, and the allowance doesn’t roll forward. A £12,000 slot used inefficiently, for short-term cash that earns a thin rate, is a slot that can’t be reused later for something with more time to compound.
That’s a different way to think about what the wrapper is for. Not as a labelled jar for whatever cash happens to be sitting around, but as a finite annual quota that has a long-term tax value attached to it. The same £12,000 deposited into a wrapper this year and held for thirty years compounds tax-free at whatever rate the underlying asset earns. Outside the wrapper, the same £12,000 earns the same nominal rate but loses some of the gain to income tax above the personal savings allowance of £1,000 for basic-rate taxpayers and £500 for higher-rate, or to capital gains tax outside the annual exempt amount.
The maths of which asset belongs in the wrapper is a separate question, and one that depends entirely on individual circumstances. The framing that matters here is simply that the wrapper is now a constrained resource. After April 2027, treating it as something with a one-tax-year shelf life and no future relevance leaves value on the table that can’t be recovered.
The bigger picture
The figure on the screen tells one story. The figure in today’s money tells another. The figure after April 2027 tells a third. None of them is the only number that matters, because the cash ISA doesn’t exist in isolation; it’s one component of a household balance sheet that includes pensions, property, other investments, and outright debt. What the cash is doing for the household depends on all of those.
That’s the part a single-rate calculator can’t model. It’s also the question that gets harder to answer with each tax year that adds a new layer to the picture. The starting point is knowing what cash itself does. The next step is fitting it into the wider view of what counts in a household’s net worth, recorded at intervals you can actually compare and what the path looks like over a longer horizon than ten years.
Last reviewed 20 May 2026.