


Most people can tell you what they earn. Far fewer can tell you what they’re worth.
That’s odd, because net worth answers a question income can’t. Income tells you what comes in. Net worth tells you what’s actually stuck: what your last twelve months of decisions add up to. It’s a still frame in a long film, and once a year is the least useful frequency to ask. Once a month is closer to the truth.
This guide walks through what net worth is in plain UK terms: what counts, what doesn’t, what’s worth arguing about, and what the figure is actually for.
The plain definition
Net worth is what you own minus what you owe. Assets minus liabilities. One number, taken at a single moment.
That’s it. There’s no business-school version, no advanced formula. Verdly publishes for education, not financial advice. Your circumstances will differ, so speak to a regulated adviser for decisions specific to you. A net worth of £42,000 means the total value of everything you own, after subtracting everything you owe, is £42,000. The number can be positive, negative, or zero, and it changes every time anything on either side moves.
Why a single number matters
Income is a flow. Spending is a flow. Net worth is a stock: the level of the reservoir at the moment you measure it.
A flow is what came in or went out over a period. A stock is what’s there right now. The two answer different questions. Income asks: how much money passed through your hands this year? Net worth asks: how much of it stayed?
That distinction matters because flows can be loud and stocks can be quiet. A pay rise feels like progress. A bonus feels like progress. A holiday booked, a kitchen redone, a new car on the drive: all of those feel like progress. None of them, on their own, tell you whether you’re actually further ahead. The net worth line does. It absorbs every decision you made about the flows and shows the cumulative effect in one figure.
What counts as an asset in the UK
An asset is anything you own that has a monetary value. In a typical UK household, that includes:
- Current accounts. The balance in your day-to-day bank account, the one your salary lands in.
- Savings. Easy-access accounts, fixed-term savings, Premium Bonds.
- ISAs. Cash ISAs, Stocks and Shares ISAs, Lifetime ISAs, Innovative Finance ISAs. The ISA itself is a wrapper, not an asset class; what counts is what’s inside it.
- Workplace pensions. Defined contribution pots from current and previous employers, valued at the current pot size.
- Personal pensions. SIPPs and other personal pensions, valued at the current pot size.
- Defined benefit pensions. These need more care; see the section on commonly debated items below.
- Property. The market value of your home, plus any buy-to-let or second properties.
- Vehicles. Cars, motorbikes, anything with a resale value. Use a rough trade-in figure, not the price paid. Whether a car belongs in the total at all is argued more often than it needs to be.
- Crypto. Bitcoin, Ethereum, and any other holdings, at current market value.
- Other investments. Shares held outside an ISA, peer-to-peer lending, gold, art, collectibles, business equity.
A note on wrappers. The terms ISA, SIPP, and LISA come up constantly in UK personal finance, and they confuse readers who hear them used as if they were investments. They aren’t. They are tax structures: boxes you put assets into, governed by HMRC rules about contributions and withdrawals. A Stocks and Shares ISA can hold the same fund a non-ISA general investment account holds; the wrapper just changes how the gains and dividends are taxed. For the purposes of net worth, what matters is the value inside the wrapper.
What counts as a liability
A liability is anything you owe to someone else. In a UK household, that’s usually:
- Mortgage. The outstanding balance on the home loan.
- Credit cards. The balance carried month to month, not the limit.
- Car finance. Hire purchase, personal contract purchase (PCP), or personal loans against the car.
- Personal loans. Anything taken on for a specific purchase or consolidation.
- Buy-now-pay-later balances. Klarna, Clearpay, PayPal Pay in 3, and similar.
- Student loans. The UK quirk; see below.
- Overdrafts. Authorised or otherwise, if currently in use.
- Tax owed. Self-assessment balances, Capital Gains Tax due, anything not yet settled with HMRC.
The UK student loan is the awkward one. Plans 1, 2, 4 and 5 are income-contingent: repayments come out automatically once income crosses the relevant threshold, and any balance left after 25 or 40 years (depending on the plan) is written off. That isn’t how a normal debt works, and whether a student loan should count against your net worth turns on that difference. Including the full outstanding balance in liabilities makes net worth look artificially low for many graduates. Excluding it entirely understates a real obligation for those whose income means it will all be repaid. There is no right answer; what matters is being consistent from snapshot to snapshot.
What’s commonly debated
A handful of items recur in UK net worth conversations.
Your primary residence. Some argue the home shouldn’t count, because you have to live somewhere and can’t “spend” the equity without selling and downsizing. Others argue it’s a real asset with a market value, and ignoring it produces a number that bears no relation to the household’s actual financial position. The practical answer is to include it but track the figure separately, so the rest of the picture is also visible at a glance. A net worth heavily concentrated in property tells a different story to one spread across pensions and investments, and both views are worth knowing.
Defined benefit pensions. A DB pension isn’t a pot. It’s an entitlement: the promise of an income stream from retirement onwards. To put a value on it for net worth purposes, the convention is to use the Cash Equivalent Transfer Value (CETV), which is the figure the scheme would pay to transfer the entitlement out. Schemes will provide a CETV on request. When using one, note that it’s a transfer value rather than a market value, and apply it consistently from snapshot to snapshot.
Depreciating assets. A three-year-old car is worth less than a one-year-old car. If it would actually be sold tomorrow, the current market value belongs in the assets. If it would never be sold, listing it is informational; it inflates the number without representing anything that can be converted. The clean rule: would this be sold if cash were needed? If yes, include it.
Human capital. Future earnings, professional qualifications, the value of a degree. These do affect financial future, but they aren’t assets in the net worth sense. Net worth is a position today, not a prediction. Leave them out.
Income versus net worth
These get conflated constantly. They are not the same number, and the gap between them tells you something important.
Income is a flow. It moves through accounts over a period: a month, a year. Spending is also a flow, in the opposite direction. The difference between the two is what gets added to (or taken from) net worth.
Two people on the same £50,000 salary can have very different net worth figures five years apart. One spends most of it; the other saves into a pension and an ISA, and overpays a mortgage. The flows look identical on a payslip. The stocks look nothing alike.
This is why earning more doesn’t automatically mean being worth more, and why someone on a lower income can sometimes be in a stronger financial position than someone earning twice as much. The number that captures the difference is net worth.
Why monthly beats daily
A snapshot is a measurement. The question is how often to take one.
Daily is too often. Markets move, exchange rates shift, the value of a Stocks and Shares ISA can swing two or three per cent in a day on no news at all. Looking at the line every morning trains an emotional reaction to noise. The brain reads daily wobbles as meaningful, and they aren’t.
Yearly is too rare. A year is long enough for the flows to wash through and the trend to be obscured by everything that happened in between. A single annual reading can’t tell you whether the line was steady or volatile across the period.
Monthly sits in the right window. It’s frequent enough that the trend becomes legible across a year, and infrequent enough that the daily noise gets smoothed out. The act of sitting down once a month to update the figures is also small enough not to feel like a chore. Why that interval and not another is a question with an arithmetic answer, worked through in how often you should check your net worth, which also covers why looking and recording are not the same act.
Verdly is built around this rhythm. The product exists to let households track net worth deliberately, with monthly snapshots; the dashboard is where the line is meant to be read.
A worked example
Take a hypothetical household. Late twenties, professional salary, no mortgage yet.
Assets:
- Current account: £2,400
- Easy-access savings: £8,000
- Stocks and Shares ISA: £14,200
- Workplace pension (DC): £18,500
- Car (estimated trade-in): £6,500
Total assets: £49,600
Liabilities:
- Credit card balance: £900
- Plan 2 student loan (outstanding): £32,000
- Personal loan: £3,200
Total liabilities: £36,100
Net worth: £13,500
Or, if the student loan is excluded on the income-contingent grounds, the figure is £45,500. Both numbers are defensible. The point isn’t which one is “right”; it’s that the underlying balance sheet is the same either way, and the household now knows where it stands. Twelve months on, with the same methodology, the change in the figure will be a real signal rather than a comparison artefact.
What the evidence actually says
A fair question worth answering on its own terms: is there research showing that people who track their net worth end up wealthier?
Not directly. There’s no randomised trial, and no longitudinal study, that isolates net worth tracking as the variable and measures the outcome ten years later.
What does exist is adjacent. Peer-reviewed work on financial self-control and self-monitoring shows that people who track their own finances (spending, saving, position) tend to save more and report higher financial well-being. The clearest reference is Strömbäck et al. (2017) in the Journal of Behavioral and Experimental Finance, which found self-control and self-monitoring behaviours predict savings outcomes and resilience independent of income.
The UK picture lines up. The FCA’s Financial Lives 2024 survey, the standard reference for consumer financial behaviour in the UK, tracks engagement, confidence and resilience together; consumers who report higher engagement with their finances also tend to report higher confidence and lower financial vulnerability.
The mechanism is plausible without being proven. Attention follows measurement, and decisions follow attention. That’s a long way from saying tracking net worth will make anyone rich. It’s closer to saying that the practice belongs to a cluster of behaviours that correlate, in the research, with healthier financial outcomes.
That’s the honest version. Use it for what it is.
Common misconceptions
A few worth retiring.
Net worth is the same as income. It isn’t. Income is the flow; net worth is the position. A high earner with high outgoings can end up with a lower net worth than a modest earner with consistent savings.
Net worth is only relevant for the wealthy. It isn’t. Net worth applies at every level, including negative. There is no threshold above which the figure becomes meaningful for the first time.
Negative net worth means failure. It doesn’t. Many UK graduates carry student loan balances larger than their assets for years. The figure is informational, not a verdict. What matters is the trajectory.
The figure alone tells you something. It barely does. A single number is a point, not a story. The trajectory is where the meaning lives: the change across multiple snapshots, not the single reading.
Where this leads
The pillar above is the definition. Before a figure can be compared it has to exist, and finding a number for everything you own is its own piece of work. The next question, naturally, is how a given figure compares.
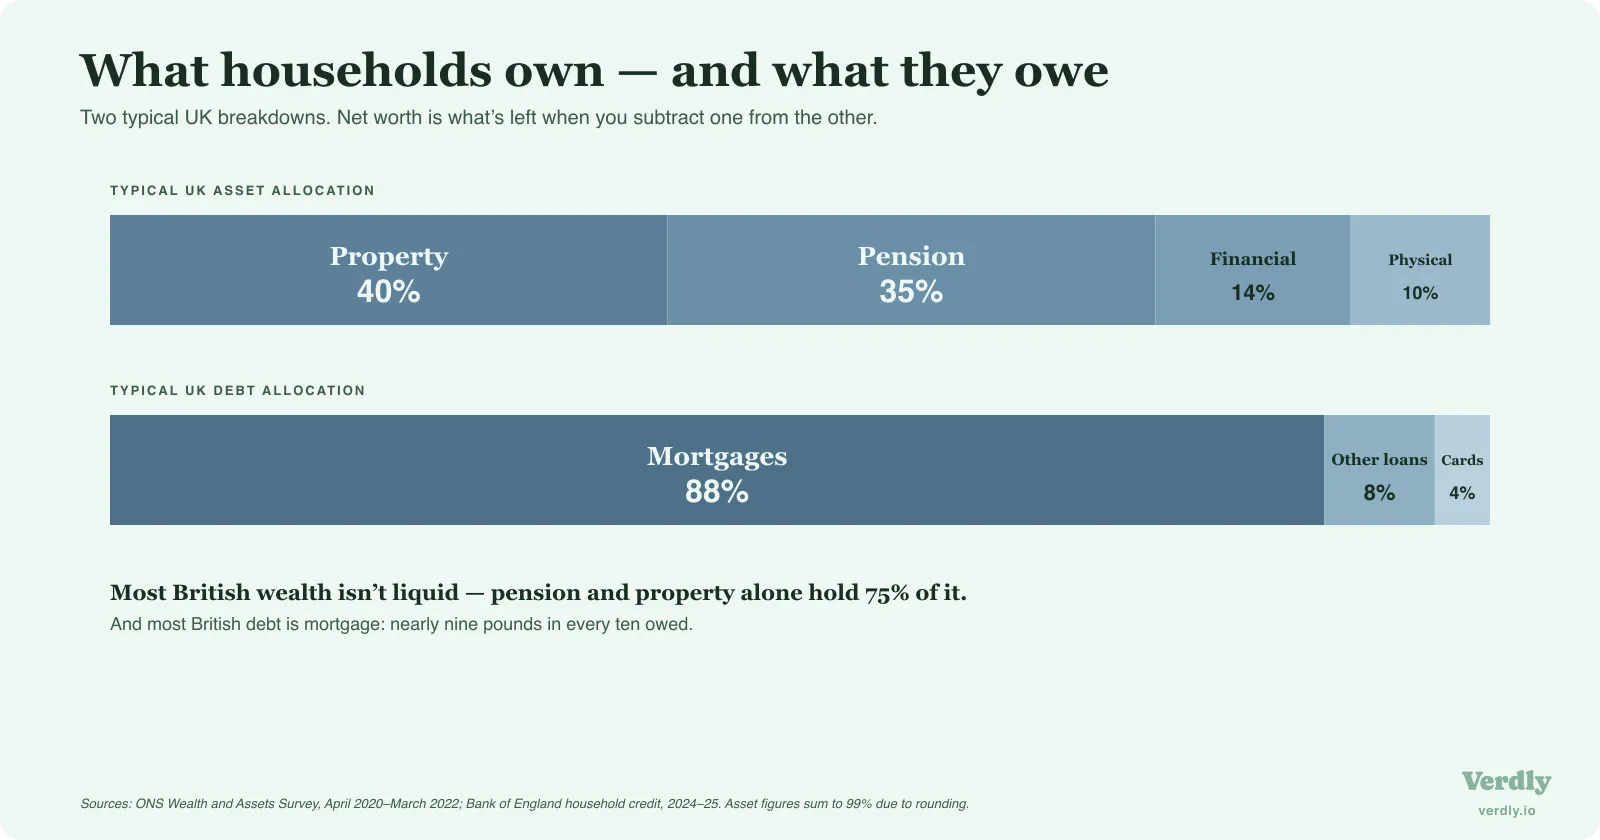
The ONS Wealth and Assets Survey is the standard UK reference. For the survey period April 2020 to March 2022, median household wealth in Great Britain was £293,700, with property accounting for around 40 per cent of the total, private pensions for 35 per cent, financial assets for 14 per cent, and physical possessions for 10 per cent. Two-thirds of UK household wealth, in other words, sits in property and pensions. The ONS Wealth Calculator is the interactive way to see where a household sits in that distribution. The ONS Wealth and Assets Survey methodology guide was most recently updated in March 2026; the next round of data, covering 2022 to 2024, is provisionally landing in 2026.
A single net worth figure is a position. Across many of them, it becomes a trajectory.
Last reviewed 12 May 2026.