


Three of the most widely read guides to this question give three different answers. One settles on once a year. One calls quarterly the sweet spot. Several say monthly and move on. Between them they cover every plausible interval, they all sound equally certain, and not one of them shows its working.
That isn’t sloppiness. It’s what happens when a question contains two questions and nobody separates them.
Two questions wearing one sentence
Checking and recording are different acts, and English blurs them because both get called “looking at your finances”.
Recording is writing a figure down with the date beside it. What the figure measures is settled: everything you own minus everything you owe. What recording adds is the date. It leaves something behind, a row that will still be there in five years when the only thing you want to know is what the shape of those five years was.
Checking is opening an app. It takes eleven seconds and leaves nothing behind at all. You can check nine times on a Tuesday and finish the day with exactly as much history as you started with.
So how often should you check your net worth is really two questions on separate clocks. One is set by how quickly the things you own produce a new number, which has an answer. The other is set by what’s going on with you, which turns out not to. Nearly every guide answers the first and hands you the result as though it settled the second. Verdly publishes for education, not financial advice. Your circumstances will differ, so speak to a regulated adviser for decisions specific to you.
The recording clock is set by what you own
The Office for National Statistics counts what British households hold. Its Wealth and Assets Survey for April 2020 to March 2022 put net property wealth at 40% of the household total and private pension wealth at 35%. Net financial wealth, meaning cash and investments once financial debts come off, accounted for 14%, and physical wealth made up the rest. Read those as the shape of the thing rather than as today’s decimals, and note that the pension share moves with the valuation method, which the ONS itself revisited in 2026.
So roughly three-quarters of what British households own sits in property and pensions, and neither hands you a new number when you ask for one. A house has no price until somebody buys it, only an estimate that doesn’t sharpen because you refreshed it on a Tuesday. A defined benefit pension has no pot at all. Finding a defensible figure for either is a job of its own, and it comes before any of this.
Which leaves that 14% doing nearly all of the visible moving. Open the app every morning and you’re watching a seventh of your wealth twitch while six-sevenths sit still, wearing whatever estimate you last gave them.
How often each thing you own makes a new number
The useful question is how often each thing you own produces a figure that wasn’t available last time. Answer it per asset and the interval picks itself.
| What you hold | When the underlying figure genuinely changes | Interval that matches it |
|---|---|---|
| Current accounts, cash savings | Balance moves daily; the rate only moves when Bank Rate does | Monthly |
| ISAs, general investment accounts | Every trading day | Monthly |
| Defined contribution pension | Every trading day, plus a step on payday | Monthly |
| Defined benefit pension | On the annual statement, or when the scheme’s assumptions change | Annually |
| Property | No observable price; indices update monthly, your actual house rarely | Annually, or on remortgage |
| Vehicles | Depreciates continuously, quotable only when you sell | Annually |
| Mortgage, personal loans, car finance | On a fixed, published schedule | Monthly |
| Credit cards, overdrafts | Daily | Monthly |
Cash makes the gap between “changes” and “changes meaningfully” clearest. Your balance moves every time you buy a coffee; what it earns moves only when the Monetary Policy Committee meets, eight times a year. It held Bank Rate at 3.75% in July 2026. Pensions are slower still. HMRC publishes its private pension statistics annually, most recently on 30 July 2026: the organisation with the fullest view of British pension wealth refreshes its picture once a year.
A month of movement, itemised
Say Priya holds £12,400 in cash, £51,200 across a Stocks and Shares ISA and a general investment account, and £78,500 in a workplace pension. She owns a flat last valued at £268,000, with £173,600 left on the mortgage. Her net worth is £236,500.
Over a month, she and her employer add £710 to the pension, £295 of mortgage capital is repaid, and her investments drift up 1.1%, worth £1,427 across the £129,700 exposed to markets. Her flat does nothing observable. New total: £238,932.
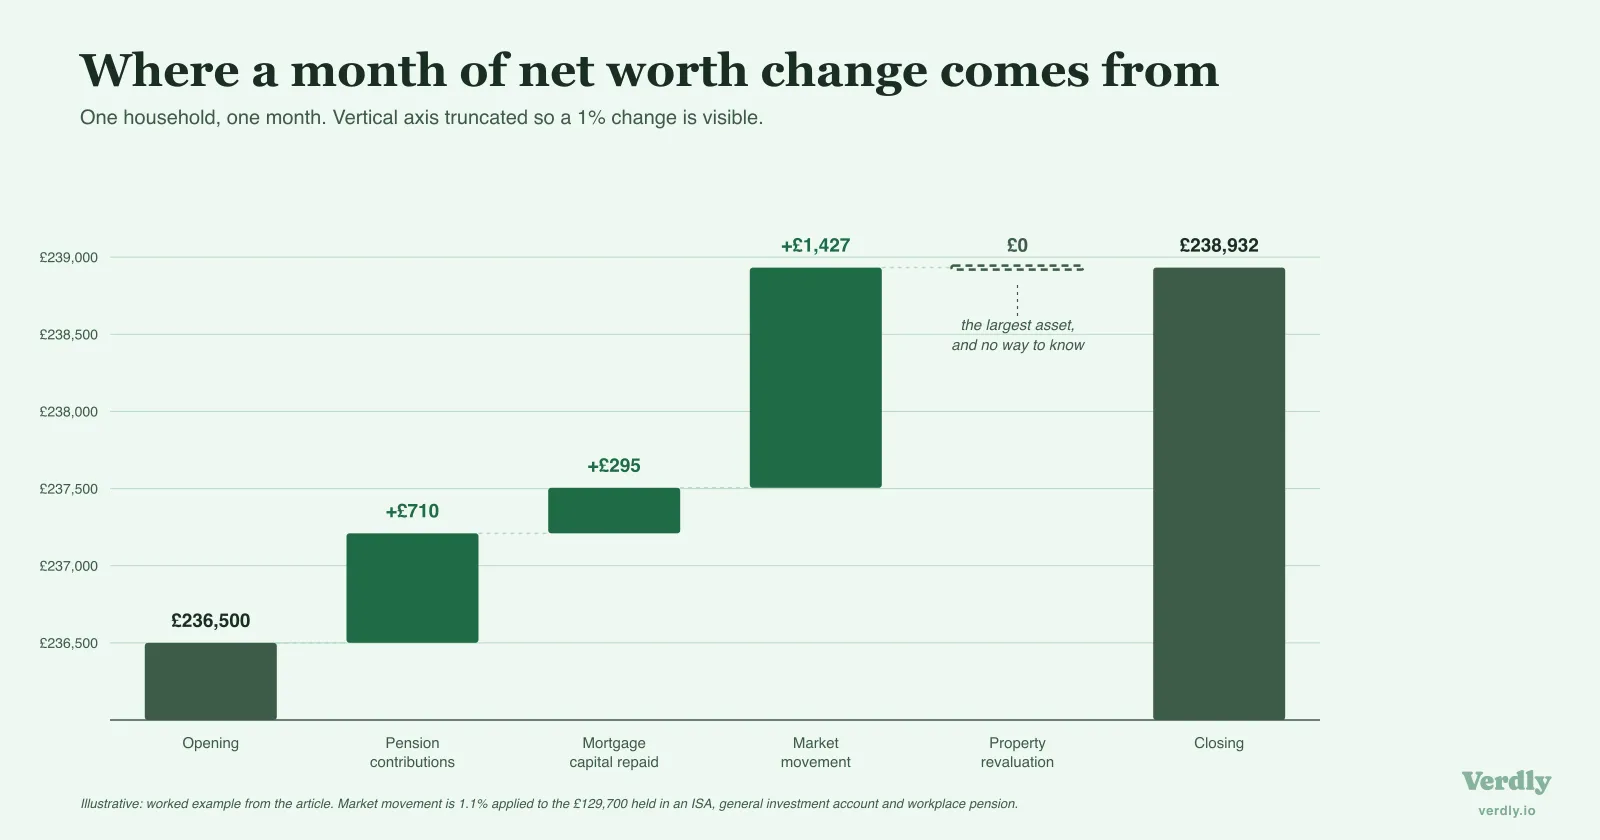
The largest single thing she owns contributed exactly zero, not because it didn’t change in value, but because there’s no honest way to know whether it did.
Run that same balance sheet every morning for thirty days and around twenty-one readings show the investments moving, all thirty show the flat unchanged, and the contributions land as one step on payday. Thirty data points describing the month, twenty-nine of them redundant.
That’s where monthly comes from, and it’s arithmetic rather than temperament: the shortest interval at which enough of the inputs have genuinely moved to be worth writing down. Quarterly works too, and for a balance sheet that’s mostly a house and a pension promise it’s arguably the more honest choice. What monthly buys is twelve points a year instead of four, which makes a trend legible sooner.
The looking clock is set by something else
Checking is a different animal, and the research on it has spent fifteen years failing to agree with itself.
In 2009, Niklas Karlsson, George Loewenstein and Duane Seppi found that investors logged in to view their portfolios less often after market downswings, across Swedish and American data. People looked away when there was bad news to see. They called it the ostrich effect, and it was absorbed into personal finance writing as settled fact.
Then a British team tested it. Svetlana Gherzi, Dan Egan, Neil Stewart, Emily Haisley and Peter Ayton, working out of Warwick and City University London, ran the same question against a new sample of active online investors and found the opposite. Monitoring rose after positive returns and after negative daily returns alike, “more like hyper-vigilant meerkats than head-in-the-sand ostriches”. The pattern held for logins that produced no trade, and for weekend logins when the markets were shut.
What predicted how often somebody looked was neuroticism, measured as a personality trait. Not the direction of the market. The person.
That is the real answer to the question in the title. If checking tracks temperament more closely than it tracks the news, no study is going to hand anyone a recommended frequency, and three guides can reach three intervals while each sounds certain, because each was describing what suited its author. It isn’t a diagnosis of anybody either. The useful reading is narrower and more freeing: the urge to look is coming from you rather than from the data, which means it isn’t information, and it doesn’t need obeying.
What monitoring actually does
There is real evidence that monitoring helps, and it gets overclaimed constantly, including by people who sell trackers.
In 2016, Benjamin Harkin and colleagues published a meta-analysis in Psychological Bulletin covering 138 studies and 19,951 participants. Monitoring interventions increased how often people monitored and promoted goal attainment, at an effect size of 0.40, with a larger effect where progress was physically recorded.
The limits matter as much as the finding. That work covers goal progress in general, leans heavily on health behaviours, and every study in it starts from a goal that already exists. It is not a study of household wealth, and it does not show that tracking your net worth makes you wealthier.
Writing the number down doesn’t change the number. What the record changes is whether next March you can see a slope instead of a single point, and a slope is the only form in which the question most people are asking has an answer. Which is why the design of the record matters more than the software: a file that lets you type over March’s figure with April’s answers “what am I worth today” perfectly and “what was I worth in March” not at all, and that is the difference between a record built to be appended to and one built to be overwritten. If you’d rather not maintain the mechanics by hand, you can keep a dated history and read the trend off it. A run of your own figures also sidesteps the trouble with comparing yourself to other people: same person, same method, the one comparison that can’t be rigged.
The month you miss
At some point you’ll skip it. Something lands in March, the update doesn’t happen, and by the time you remember it’s May.
In 2010, Phillippa Lally and colleagues at UCL followed 96 volunteers who each repeated one daily behaviour in a fixed context for twelve weeks. The median time to reach 95% of maximum automaticity was 66 days, with individuals ranging from 18 days to 254. So much for the twenty-one-day rule, and note the range: the gap between the fastest and slowest is wider than the average is long.
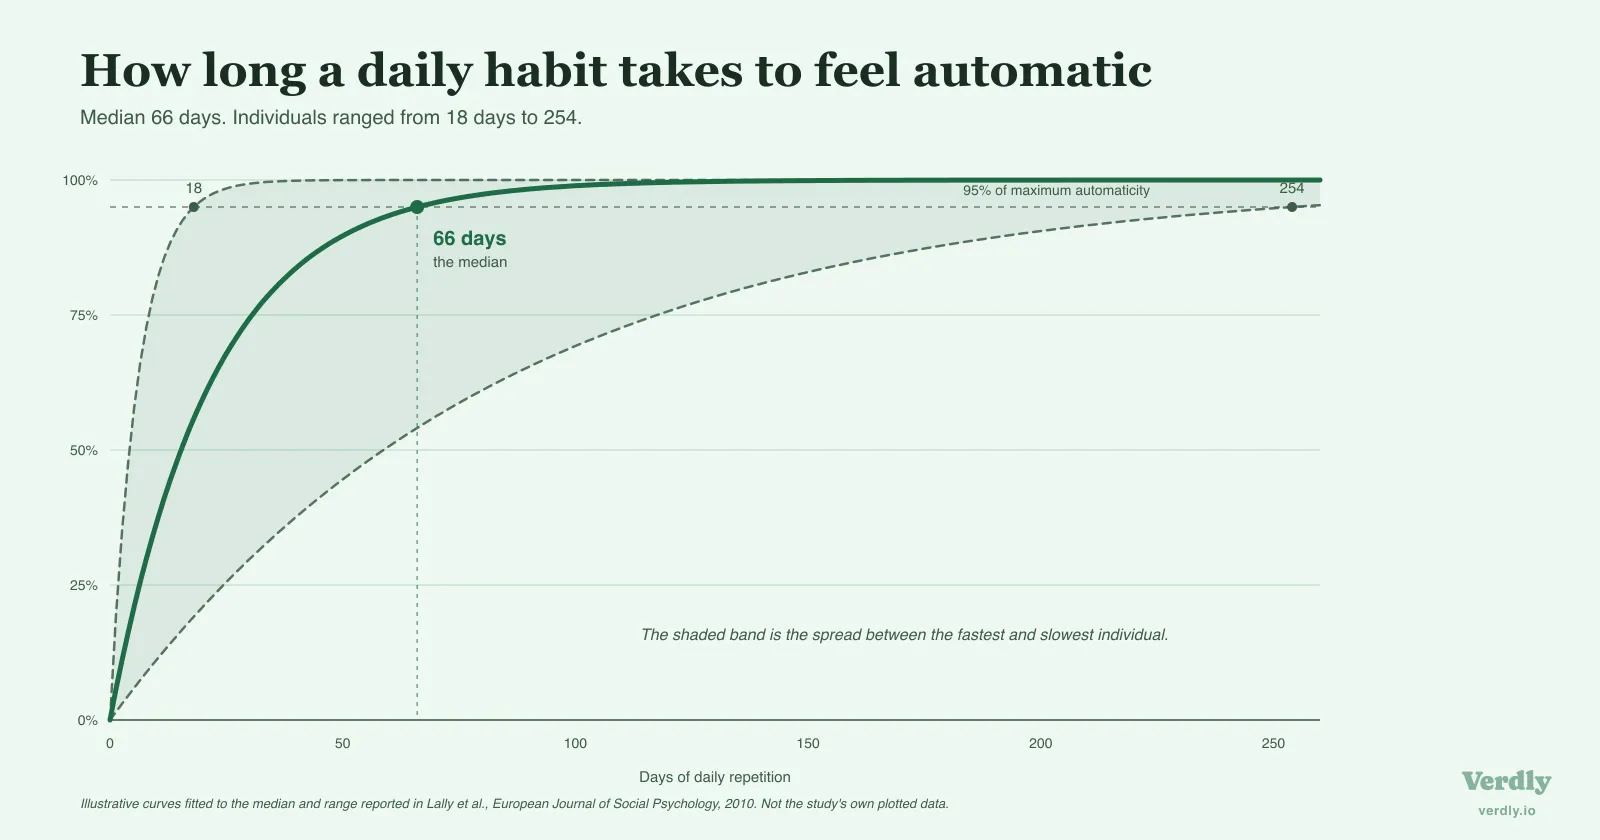
The finding that gets quoted least is the one worth keeping. Missing a single opportunity did not measurably affect the trajectory towards automaticity. The curve absorbed it. What mattered was returning to the behaviour, not preserving an unbroken run.
That’s the difference between a lapse and a failure. Skipping March costs one data point in a series you’re building for years. Concluding from March that you’re not the sort of person who does this costs the series. Which is worth remembering, because abandoning a tracking method is the ordinary case rather than the embarrassing one: most people who track their money have given up on at least one app or spreadsheet on the way to whatever they use now.
So the honest answer to how often you should check your net worth is that nobody can tell you, and the research explains why nobody can. The other question, the one about how often the figure is worth recording, has an answer sitting in what you own: roughly monthly for most British balance sheets, quarterly if yours is mostly bricks and a pension promise.
Look as often as you like. Just make sure that somewhere in all that looking, twelve times a year, somebody writes the number down.
Last reviewed 22 August 2026.