
In July 2026, the Office for National Statistics changed its mind about what a defined benefit pension is worth.
Not by a rounding error either. After the Government Actuary’s Department reviewed its method, the ONS switched the way it discounts a promised future pension back to a value today, and republished its household wealth figures on the new basis. The figures moved. As the statisticians put it themselves, there is “no single agreed method for calculating the present value” of a defined benefit claim.
Hold onto that sentence. If the national statistician needs an actuarial review to price one of these, the fuzziness you feel trying to put a defined benefit pension on your own net worth isn’t a gap in your understanding. It’s the honest state of the question.
So this is the practical version: how to put a defensible number on a defined benefit pension so it can sit on your balance sheet, and why three reasonable methods will hand you three different figures. It assumes you’ve already decided a pension belongs in your net worth in the first place. If you’re not sure it does, start there and come back.
Why this one asset has no price tag
Most pensions people pay into today are defined contribution. You and your employer pay in, the money is invested, and there’s a pot with a live value you can read off a screen. Valuing it takes about ten seconds: log in, copy the number, done. It behaves like a Stocks and Shares ISA that you can’t touch yet.
A defined benefit pension, the final-salary and career-average kind still common across the public sector and older private schemes, works nothing like that. There is no pot. What you own is a promise: a set income each year for the rest of your life once you retire, usually rising with inflation. Nobody prints a balance for a promise. That’s the whole reason these pensions get dropped from net worth sums, and it’s also why the number, once you do estimate it, tends to be far bigger than people expect.
You can put a value on a promise. You just have to accept from the start that you’re estimating, not reading. Here are the three ways to do it, from the one that needs least effort to the one that carries the most baggage.
Method one: the number your scheme already hands you
Your annual benefit statement is the first place to look, and for a lot of people it’s enough. A defined benefit statement tells you the pension you’ve built up so far, expressed as an income: “a pension of £8,400 a year, payable from 65.” That accrued figure is the raw material for everything else.
Some schemes go further and print a capital value or a “pension equivalent” alongside it. If yours does, that’s a number produced by the scheme’s own actuaries on the scheme’s own assumptions, which makes it a perfectly reasonable line to use, as long as you note where it came from. The catch is that not every statement includes one, and the ones that do rarely explain the assumptions behind it. When the statement gives you only an annual income, you need a way to turn that income into a lump sum. That’s method two.
Method two: the rule-of-thumb multiple
The quickest way to turn a promised income into a capital figure is to multiply it. The common shorthand is around twenty times the annual pension, and it isn’t plucked from nowhere: HMRC has long used a valuation factor of 20 to value defined benefit entitlements for its own tax purposes, so a pension paying £18,000 a year lands at roughly £360,000 of wealth.
That single line does a lot of work, so it earns two caveats sitting right beside it. First, twenty is a blunt instrument, not a market price. The real cost of buying a guaranteed, inflation-linked income shifts with interest rates and with your age, and a younger person’s promise is worth less today than the same promise to someone about to retire, because the money is further away. Second, treat whatever you get as an estimate with a wide margin, not a precise asset value. The multiple is useful precisely because it’s simple. Ask it to be accurate to the pound and it will let you down.
For most people tracking their own net worth, this is the sweet spot: quick, transparent, easy to reproduce next year. You lose precision and you gain a number you actually understand.
Method three: the transfer value
The third figure is the most concrete and the most loaded. A defined benefit scheme will, on request, quote a cash equivalent transfer value: the actual sum it would move out of the scheme on your behalf if you gave up the pension. It’s a real number with real money behind it, and it’s often eye-wateringly large, sometimes well north of twenty times the annual income.
It’s also the figure to handle with the most care. A transfer value is offer-specific and time-limited, it swings hard with interest rates, and it exists for a completely different purpose than net worth tracking. Verdly publishes for education, not financial advice; a transfer value is a valuation reference here, nothing more, and decisions about a defined benefit pension are exactly the kind you’d take to a regulated adviser. Reading a CETV as “what my pension is worth today” is defensible for a balance sheet. Treating it as a pot to go and unlock is a different move entirely, and one this piece is deliberately not making.
If your scheme has sent you a transfer value recently, it’s a legitimate data point. Just label it for what it is, and don’t chase a fresh quote every year to feed a spreadsheet.
Why the three numbers disagree
Line up all three for the same pension and they won’t match. The statement’s capital value, the twenty-times shorthand, and the transfer value can sit thousands of pounds apart. The gap between them is the discount rate doing its work.
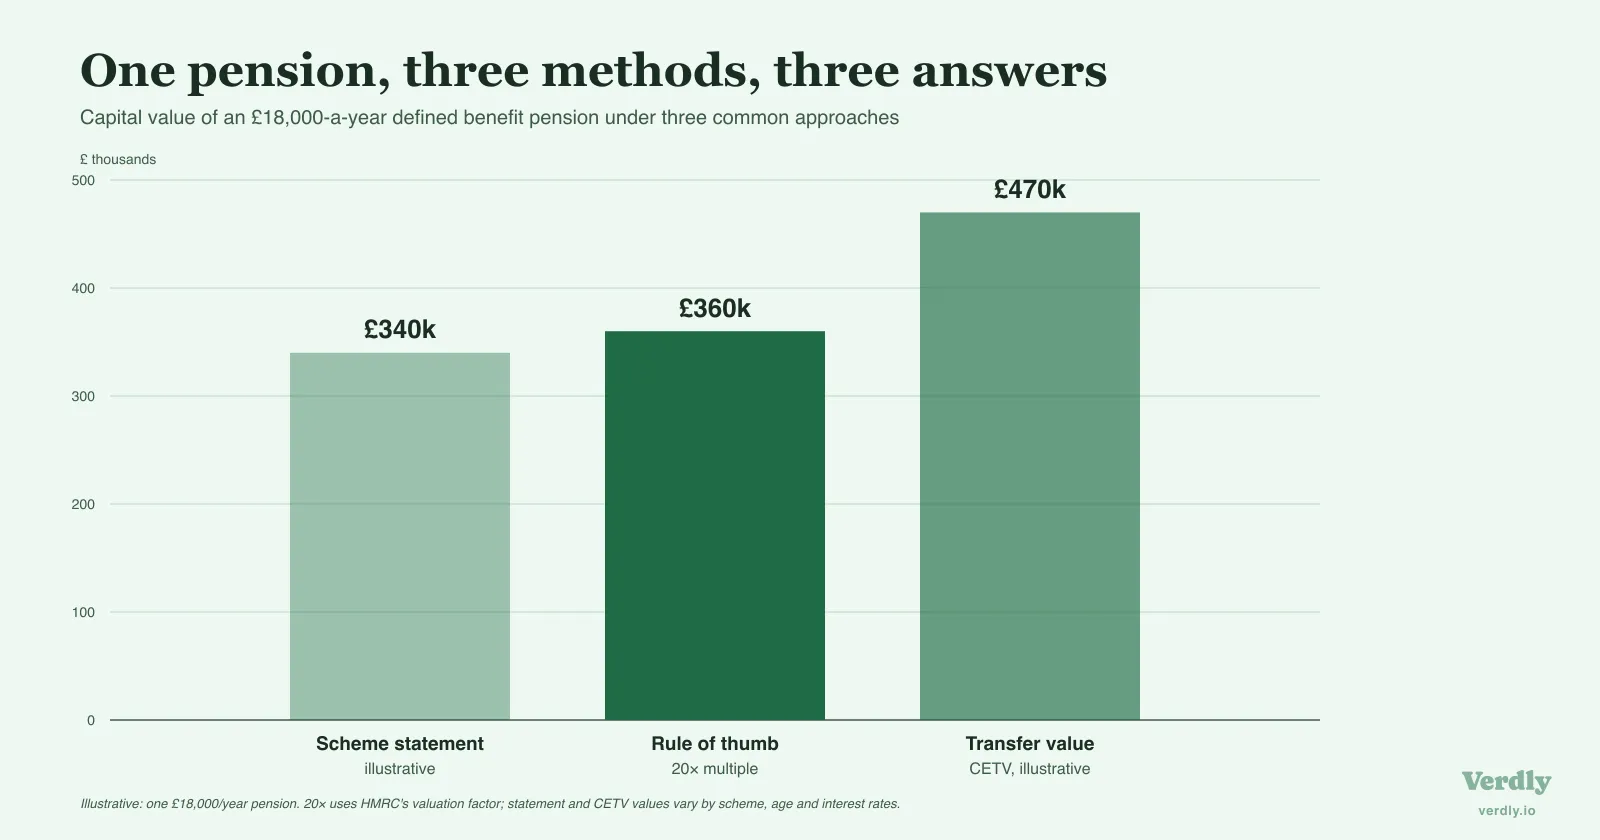
Every one of these methods has to answer the same question: how much is £1 of pension income in thirty years’ time worth today? The tool for that is a discount rate, and the ONS is refreshingly blunt about how much rides on it, calling the choice “a very important modelling decision” because for payments far in the future “the present value is very sensitive to the rate used.” Nudge the rate and the answer swings.
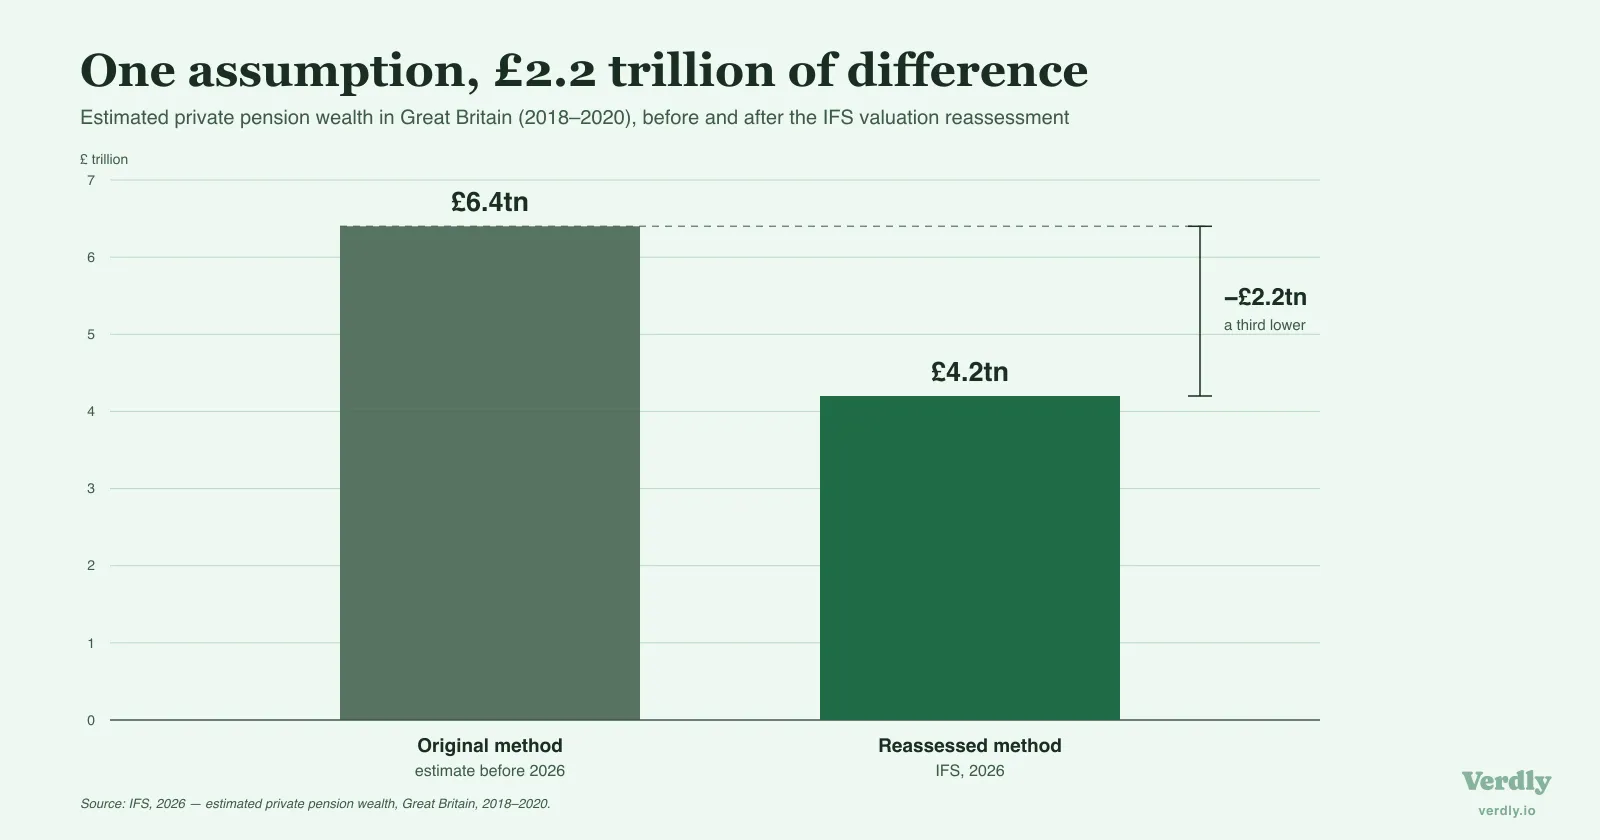
Just how much swing is on the table? The Institute for Fiscal Studies showed that reassessing the valuation method cut the estimated total of private pension wealth in Great Britain for 2018 to 2020 by more than a third, from around £6.4 trillion to roughly £4.2 trillion. Same pensions, same people, different assumption, two trillion pounds of difference. That is the entire argument in one statistic: a defined benefit pension doesn’t have a value so much as a value under an assumption. Change the assumption and the number changes with it.
Putting a number on it without kidding yourself
None of this means the exercise is hopeless, only that precision was never the point. The people whose job is to value these pensions can’t agree on a single figure, so your own line doesn’t need to be exact either. It needs to be honest and consistent.
Pick one method and stick with it. For most people the twenty-times shorthand is the right trade of effort for insight: pull the annual pension off your statement, apply a sensible multiple, write down that you used it. Log it as its own line rather than folding it into “savings,” because a promise of future income behaves very differently from cash, and a balance sheet that blurs the two tells you less than one that keeps what net worth actually measures clean. Then leave it mostly alone. A defined benefit pension isn’t a figure to refresh nervously each month; its value is a slow story told across decades, and the useful signal is the trend, not this week’s reading.
The reason to give it a permanent, clearly-labelled line at all is the same reason the ONS keeps wrestling with the method instead of giving up: for a lot of households it’s the single largest thing they own, and an estimate you understand beats a blank where the biggest asset should be. Put the pension on the page, note the method next to it, and track it alongside everything else so the biggest thing you own is carried by an estimate you chose rather than by an absence. A number with a footnote beats a certainty you don’t have.
Last reviewed 25 August 2026.