
Ask how much someone needs to retire and eventually somebody says four per cent. Multiply your annual spending by twenty-five, the saying goes, and that is the number.
It is a genuinely useful piece of arithmetic, and it comes from real research rather than folklore. It is also American, thirty years old, and built on a model of retirement that looks very little like a British one.
Verdly publishes for education, not financial advice. Nothing here is a recommendation about your own money, and withdrawal decisions in particular are exactly the kind to take to Pension Wise, the free government-backed guidance service, or to a regulated adviser.
Where the number came from
In October 1994, an American financial planner called William Bengen published Determining Withdrawal Rates Using Historical Data in the Journal of Financial Planning. He took US market data running from 1926 to 1992, built a portfolio of large US shares and intermediate-term Treasury bonds, and asked a narrow question: if someone retired in any given year and withdrew a fixed percentage of their starting pot, rising with inflation each year afterwards, what is the highest starting percentage that never ran the portfolio dry?
His answer was four per cent. In his own framing, a first-year withdrawal at that rate “should be safe”, and in no historical case had it exhausted a portfolio before 33 years.
Four years later, three professors at Trinity University in Texas ran a related exercise. Philip Cooley, Carl Hubbard and Daniel Walz published Retirement Savings: Choosing a Withdrawal Rate That Is Sustainable in the AAII Journal in February 1998, testing withdrawal rates from 3% to 12% across various portfolios and payout periods using US data from 1926 to 1995. That paper is where the phrase “the Trinity Study” comes from, and it is what turned Bengen’s finding into a rule of thumb.
One detail from it is worth carrying, because almost nobody quotes it correctly. The Trinity authors published more than one table. In the one where withdrawals are not adjusted for inflation, a 50/50 portfolio drawing 4% over 30 years survived in 100% of the historical cases. In the table where withdrawals do rise with inflation, which is the version everyone actually means by “the 4% rule”, the same portfolio survived 95% of the time.
Ninety-five, not a hundred. That five-point gap is the whole distance between a rule and a guarantee.
What happens when you run it on British data
Here is the question the popular version never asks. Bengen and the Trinity authors both used American shares, American bonds and American inflation. Does the answer hold anywhere else?
Someone checked. In December 2010, Wade Pfau published An International Perspective on Safe Withdrawal Rates: The Demise of the 4 Percent Rule? in the same journal, applying the same method to 17 developed countries using the Dimson-Marsh-Staunton dataset covering 1900 to 2008.
The United States came out at 4.02%, which is roughly where Bengen left it. The United Kingdom came out at 3.77%.
At a flat 4% withdrawal over 30 years, Pfau’s US figures showed a failure rate of 0.0%. The UK figure was 3.8%, with the worst historical British starting year running the portfolio dry at 26 years. Only four of the seventeen countries he tested cleared 4% at all.
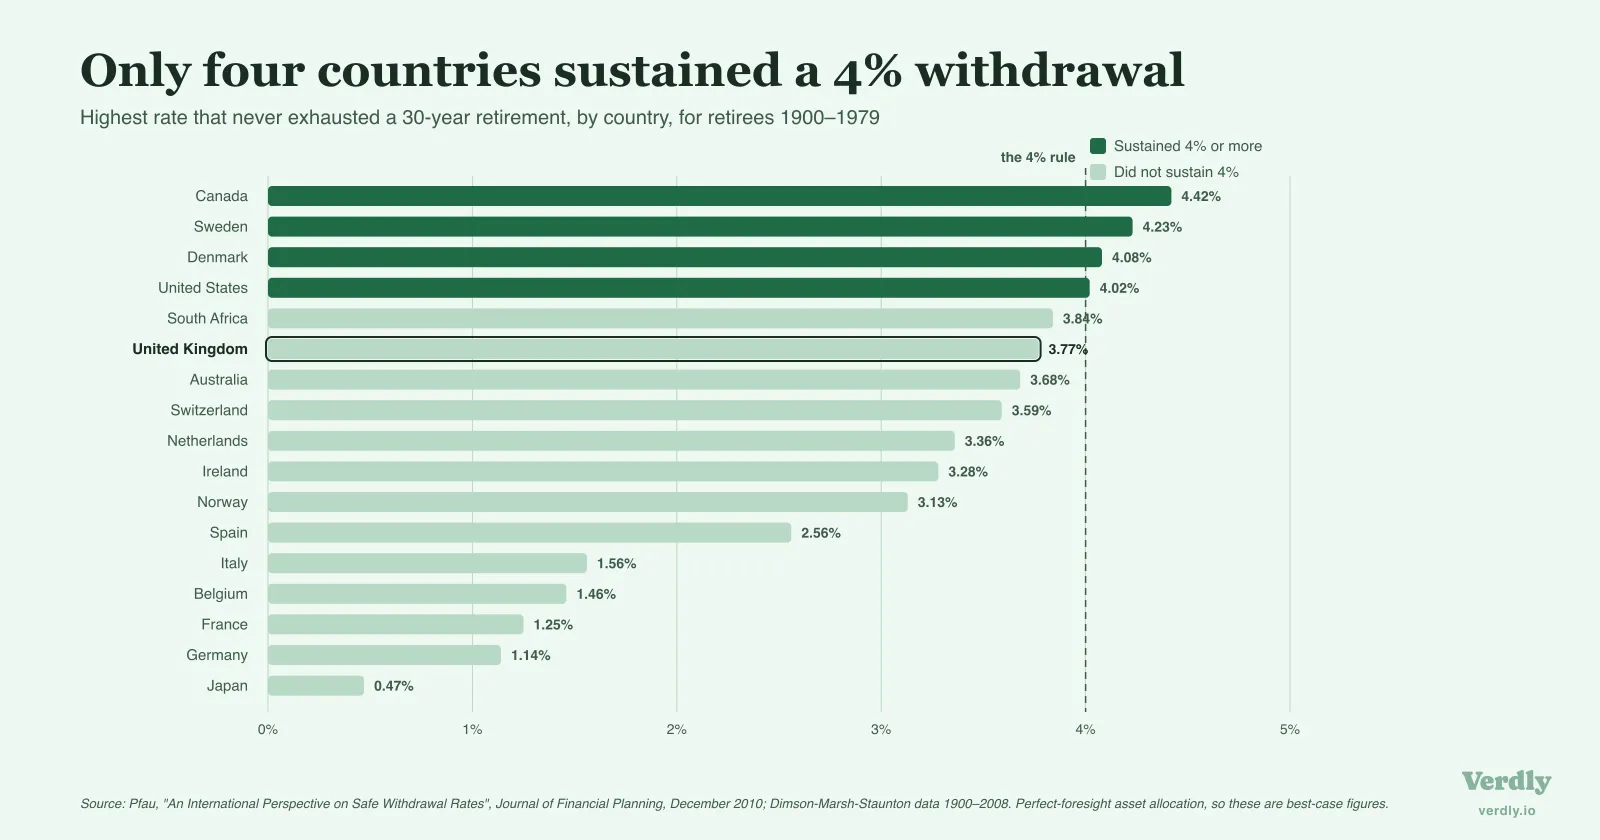
Two caveats belong immediately next to that 3.77%, and they pull in opposite directions from the way it is usually quoted.
The first is that it is a best case. Pfau’s method chose each country’s asset allocation with hindsight, picking the mix that happened to work. No real retiree has that information in advance. The second follows from it: when he re-ran the exercise with a fixed 50/50 split and no hindsight, no country in the dataset sustained 4% safely, and the American figure itself dropped to 3.66%.
So the honest summary is not “the UK number is 3.77% instead of 4%”. It is that a UK-flavoured version of this research produces a lower figure than the American one on generous assumptions, and lower still on strict ones. Other UK backtests land lower again.
Why British returns came out lower
The mechanism is not mysterious, though it is easy to overstate. In the same dataset Pfau used, UK shares returned 5.09% a year above inflation between 1900 and 2008, against 6.01% for the US. UK bonds returned 1.39% against 2.12%.
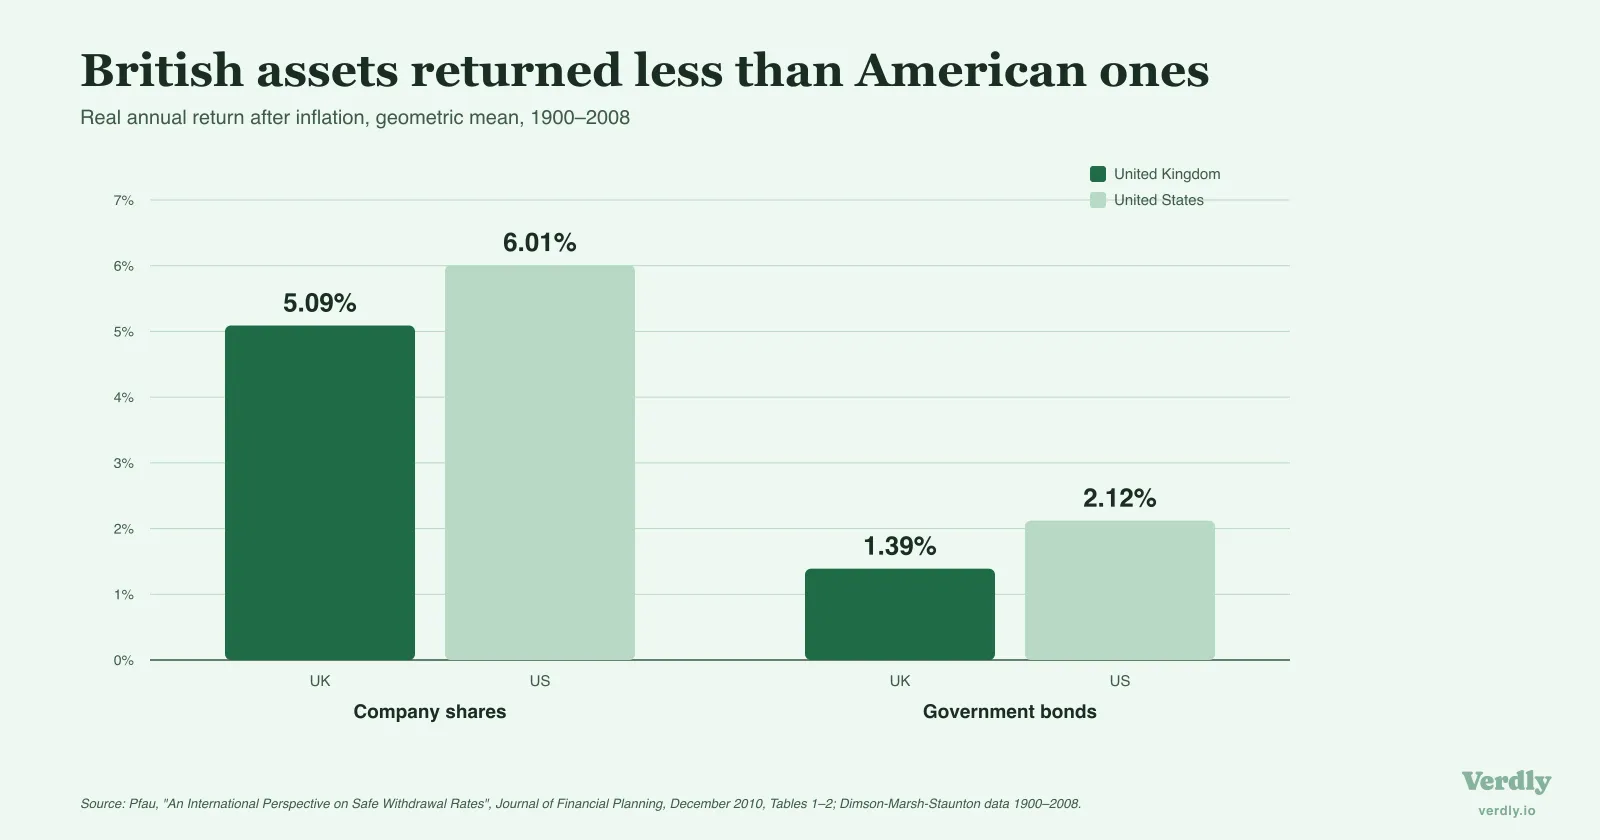
Those gaps look small. Compounded across a retirement and drawn against every year, they are not. A portfolio earning roughly a percentage point less in real terms, while paying out the same amount, runs down faster. That is most of the story.
What it is emphatically not is a prediction. A hundred years of history describes what happened, not what happens next, and the twentieth century did things to British markets that nobody would design into a forecast. The value of the exercise is that it shows how sensitive the answer is to which country’s history you happen to run it on.
The order of returns matters more than the average
There is a second mechanism at work, and it is the one that catches people out.
Sequence of returns risk is the fact that the order in which good and bad years arrive changes the outcome, even when the average is identical. It only bites when you are drawing money out. If you take a withdrawal in a year the market has fallen, you sell more units to raise the same cash, and those units are permanently gone. They are not there to recover when the market does.
Two people can retire ten years apart, experience exactly the same average return across their retirements, and end up in completely different places, purely because one met the bad decade first.
This is why the whole literature is built on testing every historical starting year rather than applying an average. “Markets return about 7%, so 5% should be fine” is arithmetic that assumes the returns arrive smoothly. They do not, and a drawdown portfolio is precisely where that assumption fails.
A British retirement is a different shape
Now the part that the argument about percentages tends to bury.
Every version of this research models the same scenario: a single pot, drawn down at a steady inflation-adjusted rate, uninterrupted for thirty years. A smooth line from the first year of retirement to the last.
A UK retirement funded partly by a pension does not have that shape. It has two corners in it.
The first corner is access. You generally cannot touch a private pension before the normal minimum pension age, which is currently 55 and rises to 57 on 6 April 2028. Some schemes differ, and firefighters, police and the armed forces are treated separately, but for most people it is a hard date. Anyone stopping work before it is funding those years entirely from what sits outside the pension: ISAs, general investment accounts, cash. The pension might be the largest thing they own and it is simply unreachable, which makes the growth rate on the accessible accounts load-bearing in a way it never is later, and turns what a decade in a cash ISA actually grows to from an idle question into a structural one.
The second corner is the State Pension. For anyone born after 5 March 1961 the State Pension age is 67; those born between 6 April 1960 and that date sit inside the phased rise from 66, which began on 6 May 2026 and moves in one-month steps. At that point, for someone with the 35 qualifying National Insurance years needed for the full rate, an inflation-linked income begins. The full new State Pension for 2026/27 is £241.30 a week, which is £12,547.60 a year.
Consider what that second corner does to the arithmetic. Before it, the portfolio carries the entire cost of living. After it, it carries whatever is left once £12,547.60 of inflation-linked income has arrived. For a household spending £30,000 a year, the pot’s job shrinks by more than a third overnight, and it never has to grow back.
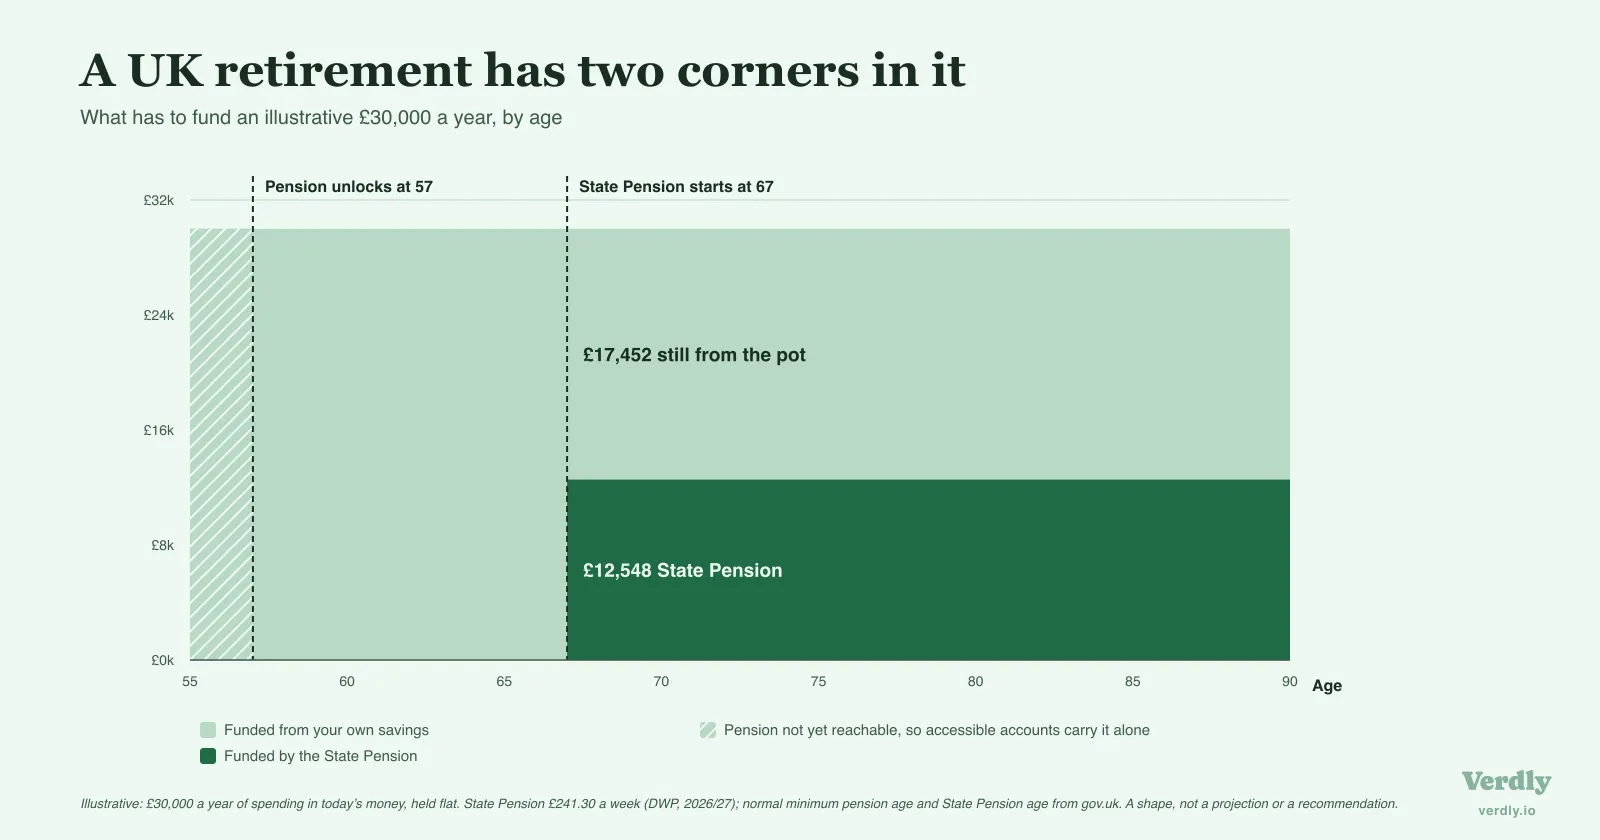
So a British retirement often looks less like one thirty-year drawdown and more like three stretches with different rules: the years before the pension unlocks, the years after it unlocks but before the State Pension starts, and the years once both are running. The heaviest demand on the portfolio usually falls in the first two, which is also when sequence of returns risk does its worst damage.
Sketch it out for someone born in the mid-1970s who stops working at 55 in the early 2030s, by which point the access age has already moved to 57. Their first two years are funded entirely from ISAs and taxable accounts, because the pension is legally out of reach no matter how large it is. From 57 to 67, the pension opens up and carries most of the load, which is ten years of drawdown at full weight. From 67, the State Pension starts and permanently absorbs a slice of the annual bill.
The birth year in that sketch is doing real work, and it is worth saying why. State Pension age depends on when you were born, and a further rise from 67 to 68 is legislated for the mid-2040s. Someone born a few years later than the person above would be looking at a stretch of eleven years rather than ten, and a step that arrives at 68. The gov.uk State Pension age tool gives the date for a specific birth date, which is the only version of it that means anything.
That is three different withdrawal problems wearing one label. The first stretch has nothing to do with the size of the pension and everything to do with what sits outside it. The second is the longest and most exposed. The third is the one the 4% rule most closely resembles, and it is the stretch where the portfolio is under the least strain.
Read that shape against a flat thirty-year line and the mismatch is obvious. A single percentage applied uniformly across all three stretches is either too cautious in the years when other income has arrived, or too loose in the years when the portfolio is doing everything on its own. Which of those two errors it makes depends on where someone is standing.
None of that makes the research wrong. It makes it a model of a different problem. Arguing about whether the right figure is 4% or 3.77% while treating the withdrawal as a flat line is answering the second-order question and skipping the first.
What the number is actually good for
The 4% rule survives all of this as something genuinely useful, as long as it is asked to do the right job.
As a rough order-of-magnitude check, it works. It tells you that a pot of £500,000 belongs in a conversation about £20,000 a year rather than £50,000, and that is a real piece of information when you are starting from nothing. The familiar shorthand of multiplying annual spending by twenty-five is just the same sum inverted, and it inherits every assumption underneath it, including the American data and the flat thirty-year line.
What it is not is a promise about your own retirement. The research it rests on is a set of historical simulations run on one country’s markets, reported by named researchers, over defined periods, with stated assumptions. Bengen himself has revised his figure upward over the years, most recently in practitioner commentary rather than a new journal paper, and on the basis of a far more diversified portfolio than the one in the original study. That tells you something about how load-bearing those assumptions are.
The more useful question than “what rate is safe” is “what does the shape of my own retirement look like, and what does the portfolio actually have to cover in each stretch of it”. That question has no single number as an answer, which is presumably why it makes for worse headlines.
It does, however, have a starting point, and the starting point is knowing what you have. That means whether a pension belongs in your net worth at all, putting a defensible value on a defined benefit pension if you have one, and knowing which pots are reachable before 57 and which are not. It is also worth a glance at where UK net worth sits by age, if only to see how much of the national total is locked in pensions and property rather than the accessible accounts that would have to fund an early stretch.
A net worth tracker that keeps those as separate, labelled lines will tell you more about the corners in your own retirement than any percentage will. Recording each account on its own line, with a note of when you can actually reach it, turns the access question from something you work out on the day into something already sitting in front of you, and watching the trend and its projection across enough years gives the shape time to become visible.
A rule that travelled further than its data
The 4% rule earned its fame by turning an unanswerable question into a number you could hold in your head. That was a real service, and the arithmetic behind it was careful work.
But it was careful work about American markets and a smooth thirty-year line, and it has been repeated so often that the assumptions fell off somewhere along the way. What is left circulating is a percentage detached from the study that produced it.
The British version of the question has a pension you cannot open until 57, a State Pension that arrives partway through and changes everything after it, and a century of market history that produced a lower answer than America’s did. Those are the features worth understanding. The percentage is downstream of all of them.
Last reviewed 31 August 2026.